Click on the About tab within each sample for product and release requirements.
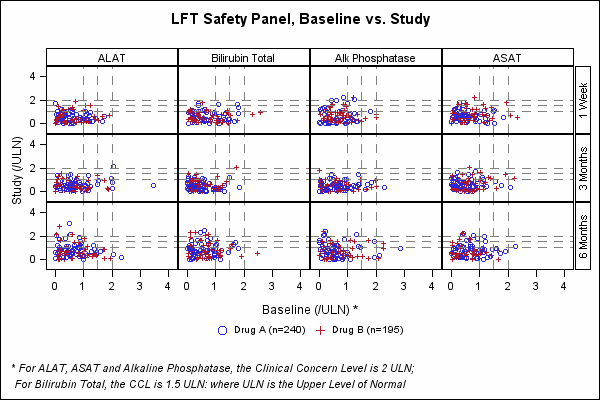
Sample 39192 - Liver function test safety panel, baseline vs. study[ View Code ]
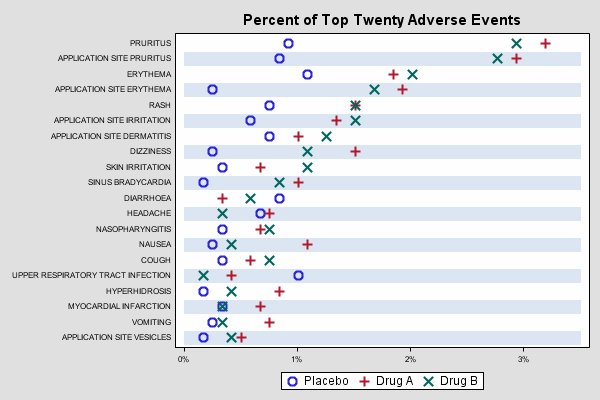
Sample 39173 - Percent of top twenty adverse events[ View Code ]
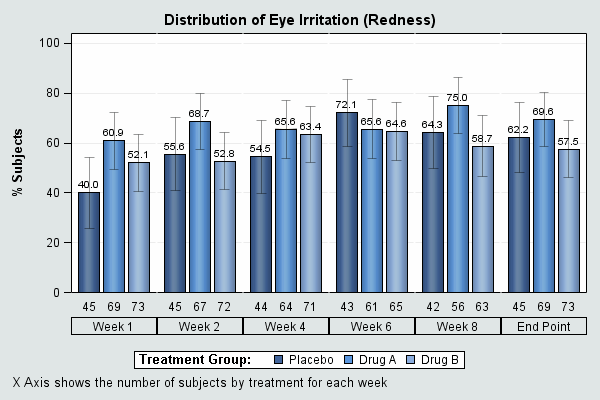
Sample 39166 - Distribution of eye irritation[ View Code ]
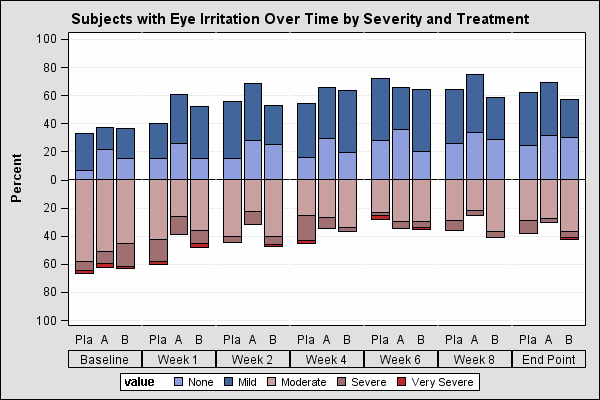
Sample 39144 - Subjects with eye irritation over time by severity and treatment[ View Code ]
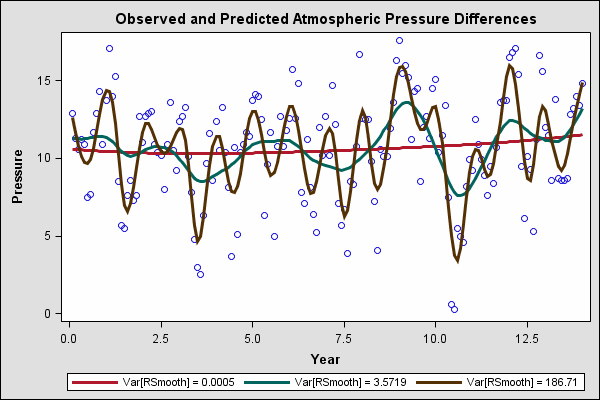
Sample 39137 - Observed and predicted atmospheric pressure differences[ View Code ]
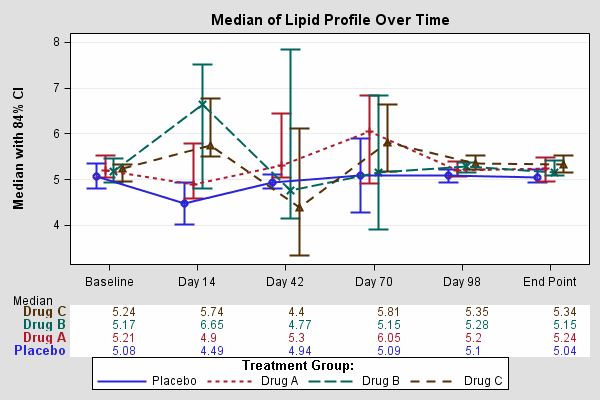
Sample 39132 - Median of lipid profile over time[ View Code ]
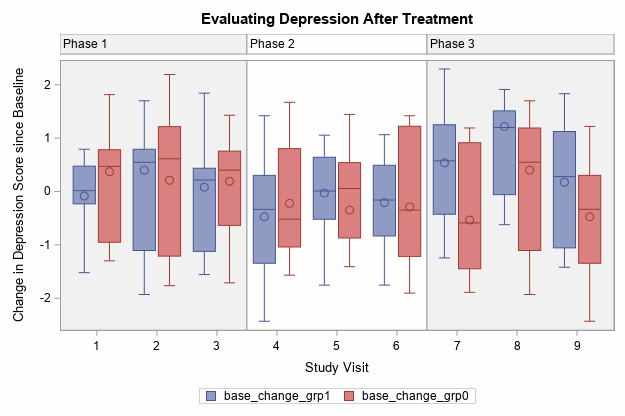
Sample 39101 - Grouped box plot with droplines[ View Code ]

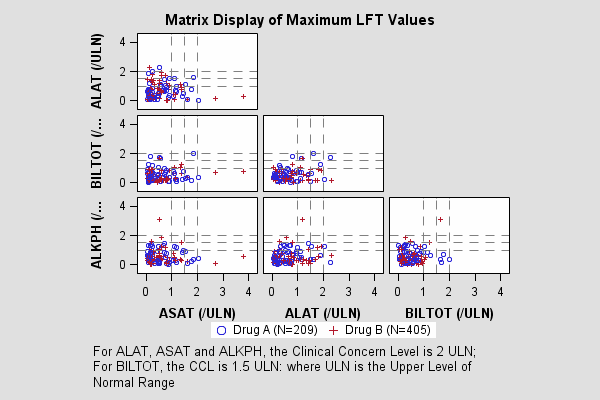
Sample 39100 - Matrix display of maximum LFT values[ View Code ]
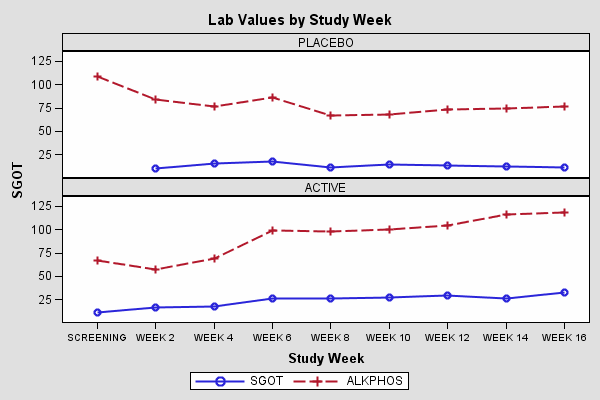
Sample 39099 - Lab values by study week[ View Code ]
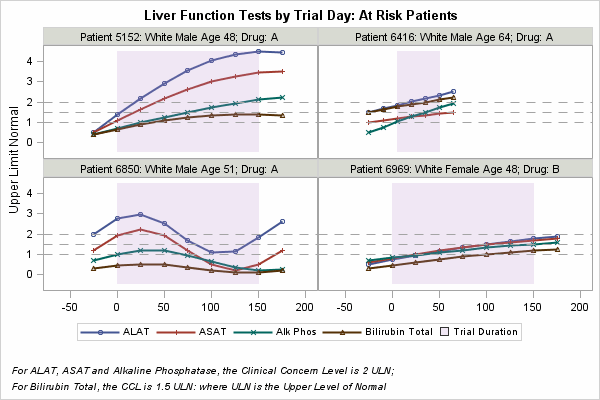
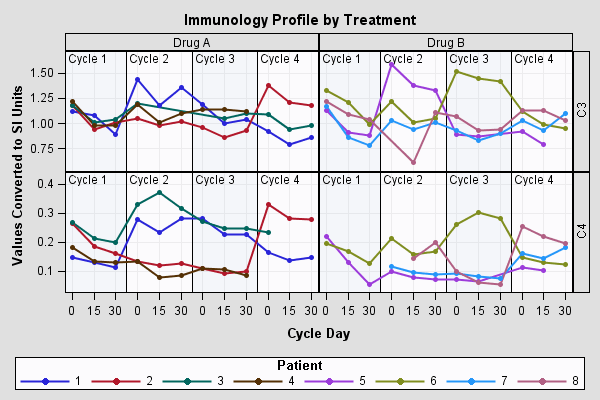
Sample 39092 - Patient profile by treatment[ View Code ]
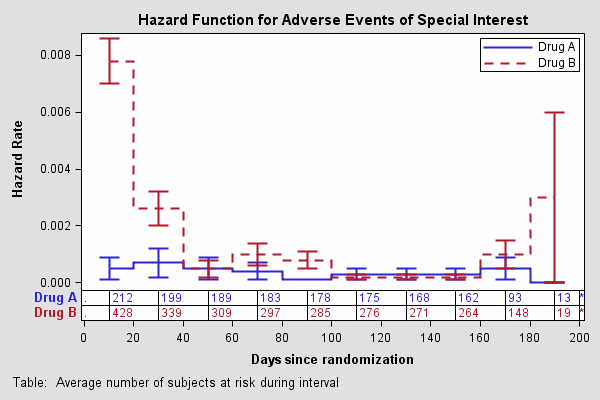
Sample 39090 - Hazard function for adverse events of special interest[ View Code ]
Sample 39086 - Box plot by group[ View Code ]
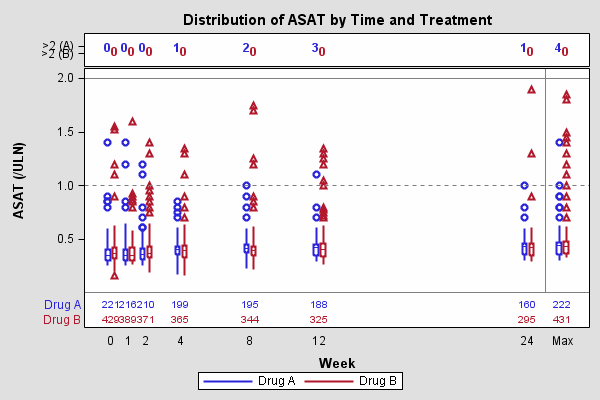
Sample 39080 - Drug distribution by time and treatment[ View Code ]
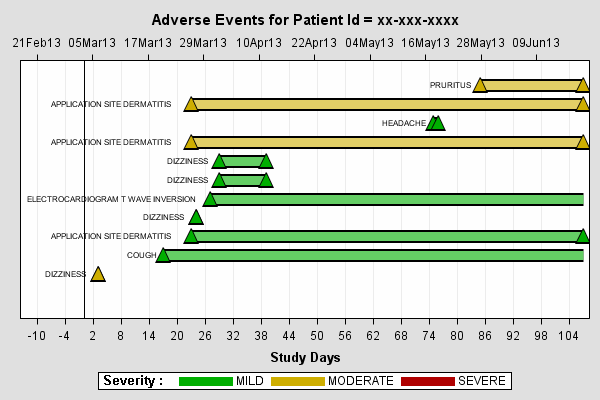
Sample 39078 - Adverse events for patient ID[ View Code ]
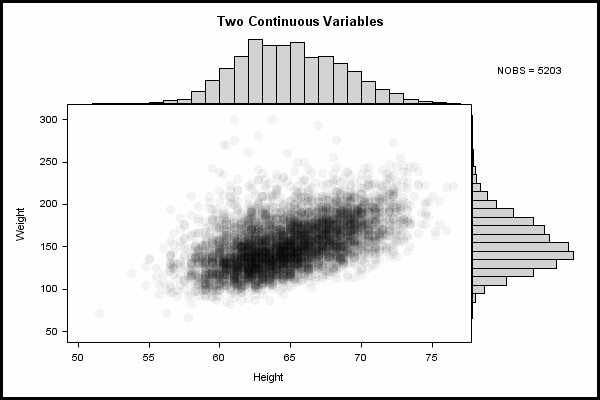
Sample 35172 - Distribution plot[ View Code ]
Sample 35164 - Cholesterol by sex and age group[ View Code ]

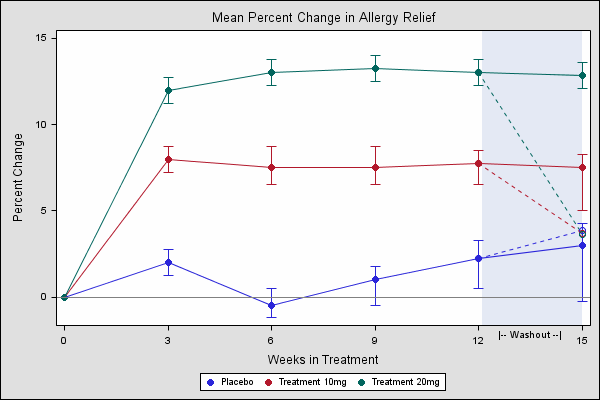
Sample 35053 - Mean percent change in allergy relief[ View Code ]
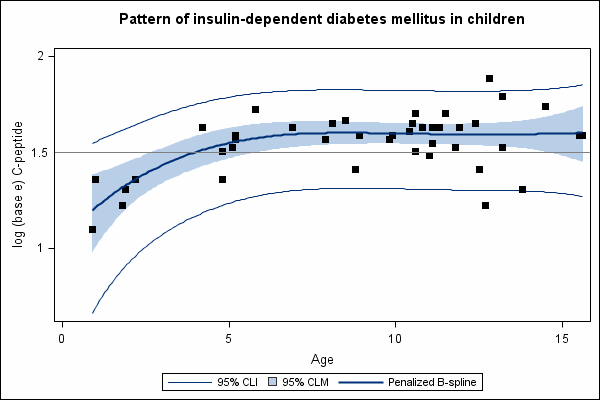
Sample 35052 - Pattern of insulin-dependent diabetes mellitus in children[ View Code ]
Sample 31510 - Stacked band plot with overlay lines[ View Code ]