The main responsibility of a RadarChartTableDataModel is to determine which data variables are used in the radar chart and what role each variable plays. The primary roles are
The following code fragment graphs the causes of failure for different cleaning processes that were used by two manufacturing systems. The code assigns the Category and Response variable roles to data columns named Cause and Count:
// Create a data source that must contain a string column
// named Cause and a numeric column named Count
   javax.swing.table.TableModel dataTable = <...>;

// Create a data model and attach the data source to it
   RadarChartTableDataModel dataModel=
        new RadarChartTableDataModel();
   dataModel.setModel(dataTable);

// Assign the Category and Response variable roles
// to appropriate variable(s)
   dataModel.setCategoryVariable(
     new ClassificationVariable("Cause"));
   dataModel.setResponseVariable(
     new AnalysisVariable("Count"));

// Create a RadarChart and attach the data model to it
   RadarChart radarChart = new RadarChart();
   radarChart.setDataModel(dataModel);
When a data model is assigned to a RadarChart, the chart summarizes the data before displaying it. During summarization
The following statistics are the default calculations:
The AnalysisVariable constructor can be used to specify a statistic to calcuate. Valid statistics to calculate are a frequency count, a sum, or a mean. The following code fragment specifies a mean:
AnalysisVariable response=new AnalysisVariable(
  "Var1"                            // column for Response role
  ,GraphConstants.STATISTIC_MEAN    // statistic to calculate
);
RadarChartTableDataModel dataModel=new RadarChartTableDataModel();
dataModel.setResponseVariable(response);
To identify data subgroups according to the values of a ClassificationVariable, assign the SubroupVariable role to the appropriate classification variable. The chart generates a separate star for each value of the Subgroup variable. All stars are overlapped on the same set of spokes.
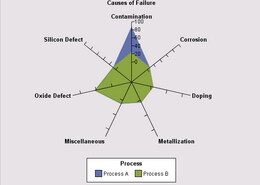
For example, if a chart represents the causes of failure for two different cleaning processes in a manufacturing system, a variable named Process might be assigned the Subgroup role to identify each process. The Subgroup role would cause a separate star to be generated for each process. The assignment would resemble the following:
RadarChartTableDataModel dataModel=
  new RadarChartTableDataModel();
dataModel.setSubgroupVariable(new ClassificationVariable("Process"));
Different colored area fills are used to represent each unique value of the Subgroup variable. To turn off the area fills, get the chart's RadarChartModel and call the model's setFilledRadar() method with the argument value false, as in
radarChart.getGraphModel().setFilledRadar(false);
Separate RadarCharts can be generated for each value of a ClassificationVariable by assigning either the ColumnVariable or RowVariable role to that variable.
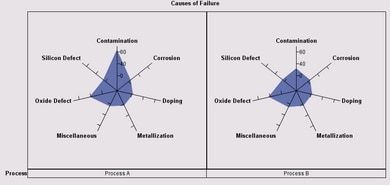
For example, when charting the causes of failure for two different cleaning processes in a manufacturing system, a variable named Process might be assigned the Column role so that a separate chart is generated for each process. The assignment would resemble the following:
RadarChartTableDataModel dataModel=
  new RadarChartTableDataModel();
dataModel.setColumnVariable(new ClassificationVariable("Process"));
If the Column role is assigned, charts are aligned horizontally by the specified variable's values. If the Row role is assigned, charts are aligned vertically by the variable's values. In either case, each chart has its own axes.
The Column and Row variable roles can both be assigned to the same graph. In that case, a separate radar chart is produced for each unique pair of (column, row) values, and the charts are displayed in a grid. For example, when charting the causes of failure for two cleaning processes used in a manufacturing system, a variable named Day might be assigned the Column role and a variable named Process might be assigned the Row role. In this case, a separate chart is generated for each process's failures on each day.
The following table summarizes the RadarChartTableDataModel variable roles and the type of data each role supports.
| Variable Role | Class Type | Numeric | String | Multiple Variables |
|---|---|---|---|---|
| CategoryVariable* Assigns the variable whose values determine the number and arrangement of spokes in the radar chart. |
ClassificationVariable | Yes | Yes | Yes |
| ResponseVariable Assigns the variable whose values are used to calculate the chart statistic and therefore determine the lenth of the spokes |
AnalysisVariable | Yes | No | Yes |
| SubgroupVariable Generates a separate star for each subgroup value, and the stars are overlapped on the same set of spokes |
ClassificationVariable | No | Yes | No |
| ColumnVariable Generates a separate radar chart for each value of the specified variable and aligns the multiple charts in columns |
ClassificationVariable | Yes | Yes | Yes |
| RowVariable Generates a separate radar chart for each value of the specified variable and aligns the multiple charts in rows |
ClassificationVariable | Yes | Yes | Yes |
| * required variable | ||||
To generate a graph, a RadarChart needs a data column for the CategoryVariable role. If the Category role is not assigned in the program code, a RadarChart selects the first string column found in the RadarChartTableDataModel and uses it as its Category variable. If there is no string column in the data, then it selects the first numeric column.
This default behavior occurs only when the Category role is not assigned. If the role is assigned to a variable that does not exist in the data, the RadarChart cannot display a graph.
If the ResponseVariable role is not assigned in the program code, then the lengths of the spoke vertices represent a frequency count of the Category values. If the ResponseVariable role is assigned, then the default statistic for the spoke vertices is the sum of the response values for each category value.
A RadarChartTableDataModel fires property change events when
For example, if the name property is changed in the ClassificationVariable that has been assigned the CategoryVariable role, the RadarChartTableDataModel fires a ProeprtyChangeEvent stating that the CategoryVariable has changed.
When variable roles are assigned, the RadarChartTableDataModel does not confirm that the variables exist in the TableModel. Thus, assigning a non-existent data column to a variable role may mean that the RadarChart cannot display a graph. For example, if the CategoryVariable role is assigned to a Cause column but the TableModel does not contain a Cause column, then the RadarChart fails to produce a graph.
If the CategoryVariable role is correctly assiged to an existing variable but another role is incorrectly assigned, the RadarChart displays a graph without the incorrect role. For example, if the CategoryVariable role is correctly assigned but the ColumnVariable role is not, a graph using the Category role is generated, but the Column role is ignored.