<%// SpecifyStatistic:%>
<%
// To specify a statistic, use the AnalysisVariable constructor
%>
<%@page import="
com.sas.servlet.tbeans.graphics.html.RadarChart,
com.sas.graphics.components.radarchart.RadarChartTableDataModel,
com.sas.graphics.components.AnalysisVariable,
com.sas.graphics.components.ClassificationVariable,
com.sas.graphics.components.GraphConstants,
com.sas.swing.models.TableModelAdapter,
com.sas.models.SimpleTable"
%>
<%
// Create a RadarChart instance
RadarChart radarChart = new RadarChart();
// Create a simple SAS table and add data to it
SimpleTable table = new SimpleTable();
%>
<%@ include file="FailData.jsp"%>
<%
// Convert a simple SAS table to a simple Java Swing table
TableModelAdapter tma = new TableModelAdapter(table);
tma.setFormattedDataUsed(false);
// Create a data model and attach the data source
RadarChartTableDataModel dataModel=
new RadarChartTableDataModel(tma);
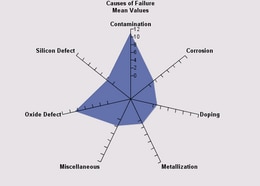
// Create an AnalysisVariable and specify statistic
AnalysisVariable responseVar=new AnalysisVariable(
"Count" // column for Response role
,GraphConstants.STATISTIC_MEAN // statistic to calculate
);
// Assign the Category and Response variable roles
dataModel.setCategoryVariable(
new ClassificationVariable("Cause"));
dataModel.setResponseVariable(responseVar);
// Assign the data model to the BarChart
radarChart.setDataModel(dataModel);
// Set a graph title
radarChart.getTitle1().setText("Causes of Failure");
radarChart.getTitle2().setText("Mean Values");
// Set HTTP-specific response and request functionality
radarChart.setResponse(response);
radarChart.setRequest(request);
// Write the chart to the display
radarChart.write(out);
%>