Annotation data for a Gantt chart can be stored in a GanttChartAnnotationTableDataModel or in a GanttChartTableDataModel. Using the GanttChartAnnotationTableDataModel is recommended when you need maximum flexibility for setting multiple annotations on a single bar.
A GanttChartAnnotationTableDataModel provides the following methods for setting the annotations on a chart:
setTaskVariable(Variable)setSymbolVariable(Variable)setSymbolColorVariable(Variable)setLabelVariable(Variable)setLabelColorVariable(Variable)setLocationVariable(Variable)setPositionVariable(Variable)The following table shows data for three annotations: two symbols and a text label. The table header shows the variable names used in the data, and the rows show the data values.
| Task | Symbol | Label | Position | Color |
|---|---|---|---|---|
| Manufacturer Demos | MarkerStyle.SYMBOL_DIAMOND_FILLED | null | 04NOV | blue |
| Determine Users | null | tenuous date >>> | 06NOV | blue |
| Determine Users | MarkerStyle.SYMBOL_SQUARE_FILLED | null | 03NOV | blue |
The following graph is generated when these variables are set in the GanttChartAnnotationTableDataModel, as shown by the code fragment.

// Create the model for the schedule data
   GanttChartTableDataModel dataModel=
     new GanttChartTableDataModel(scheduleData);

// Create the model for the annotation data
   GanttChartAnnotationTableDataModel annoModel=
     new GanttChartAnnotationTableDataModel(annoData);

// Set the annotation model on the schedule model
   dataModel.setAnnotationTableDataModel(annoModel);

// Assign the annotation values to the annotation data model
   annoModel.setTaskVariable(new Variable("Task"));

   annoModel.setSymbolVariable(new Variable("Symbol"));
   annoModel.setSymbolColorVariable(new Variable("Color"));

   annoModel.setLabelVariable(new Variable("Label"));
   annoModel.setLabelColorVariable(new Variable("Color"));

   annoModel.setPositionVariable(new Variable("Position", "DATE5.", "DATE5.", "Absolute Position"));
A GanttChartAnnotationTableDataModel provides two methods for positioning annotations along the date axis:
setLocationVariable(Variable)| ES | Sets the annotation to the task's Early Start date |
| EF | Sets the annotation to the task's Early Finish date |
| LS | Sets the annotation to the task's Late Start date |
| LF | Sets the annotation to the task's Late Finish date |
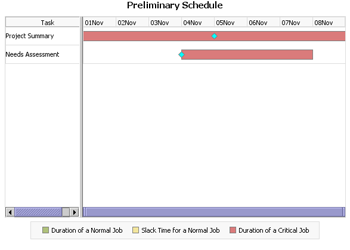
setPositionVariable(Variable)The following table shows data for two annotations. The table header shows the variable names used for the data, and the rows show the data values.
| Task | Symbol | Location | Position | Color |
|---|---|---|---|---|
| Project Summary | MarkerStyle.SYMBOL_DIAMOND_FILLED | null | 05NOV | cyan |
| Needs Assessment | MarkerStyle.SYMBOL_DIAMOND_FILLED | ES | null | cyan |
The following graph is generated when these variables are set in the GanttChartAnnotationTableDataModel, as shown by the code fragment.

// Create the model for the schedule data
   GanttChartTableDataModel dataModel=
     new GanttChartTableDataModel(scheduleData);

// Create the model for the annotation data
   GanttChartAnnotationTableDataModel annoModel=
     new GanttChartAnnotationTableDataModel(annoData);

// Set the annotation model on the schedule model
   dataModel.setAnnotationTableDataModel(annoModel);

// Assign the annotation values to the annotation data model
   annoModel.setTaskVariable(new Variable("Task"));

   annoModel.setSymbolVariable(new Variable("Symbol"));
   annoModel.setSymbolColorVariable(new Variable("Color"));

   annoModel.setLocationVariable(new Variable("Location"));
   annoModel.setPositionVariable(new Variable("Position", "DATE5.", "DATE5.", "Position"));