Problem Note 61752: SAS® Report Viewer might not correctly restore a maximized graph in a SAS® Visual Analytics report
 |  |  |  |
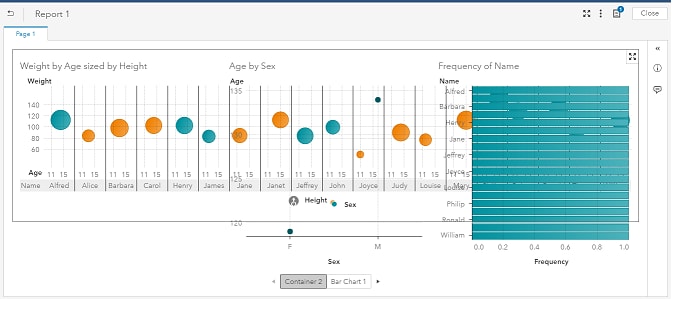
SAS Report Viewer might not correctly restore a maximized graph in a SAS Visual Analytics report. Specifically, the problem occurs when the graph is inside a container that is inside another container. For example, suppose that your report is designed like this:
- Container 1 is a stacked container that contains a graph and Container 2, which is a standard container.
- Container 2 contains several objects including a graph.
You open the report in SAS Report Viewer, and select Container 2. You maximize one of the graphs. At this point, the report is displayed properly. However, when you restore the graph to its normal size, the graph overlays the other objects in Container 2. The following display illustrates the issue:
There are a couple of workarounds:
- Instead of restoring the maximized graph, you can refresh the entire report. Refreshing the report restores the graph to its normal size.
- You can redesign the report so that it does not have containers within other containers. In the example, you would remove Container 1 from the report.
Click the Hot Fix tab in this note to access the hot fix for this issue.
Operating System and Release Information
| Product Family | Product | System | Product Release | SAS Release | ||
| Reported | Fixed* | Reported | Fixed* | |||
| SAS System | SAS Visual Analytics | Linux for x64 | 8.2 | 8.3 | Viya | Viya |
| SAS System | SAS Report Viewer | Linux for x64 | 8.2 | 8.3 | Viya | Viya |
An update for this issue is available for SAS Viya 3.3. For instructions on how to access and apply software updates, see the Managing Your Software section of the SAS Viya 3.3 Administration document at
http://documentation.sas.com/?softwareId=administration&softwareVersion=3.3&softwareContextId=softwareUpdates| Type: | Problem Note |
| Priority: | high |
| Date Modified: | 2018-04-12 13:31:32 |
| Date Created: | 2018-01-25 10:33:42 |