Usage Note 60337: SAS® Visual Analytics Designer might unexpectedly display a message that data is not valid for animation
 |  |  |
Overview
When you add animation to a geo map, SAS Visual Analytics Designer might display the following message:
This message might be identifying a valid problem with duplicated values, but it can also occur when the result set for the geo map has exceeded the cardinality limit. By default, the result set for the geo map cannot exceed 5,000 rows. To reduce the number of rows, you can change the format for the date used in the geo map. For example, if the date is formatted as MMDDYYYY, then try changing it to MMYYYY. You can also apply a filter to reduce the number of rows.
How to calculate the number of rows
To capture the point in time at which the rows exceed the limit, you can follow these steps. This example uses ZIP code and date.
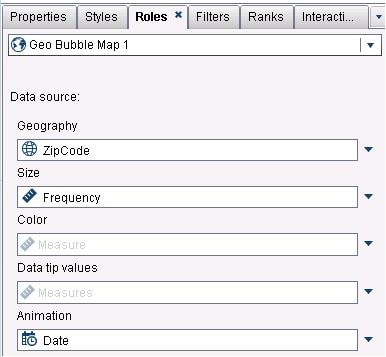
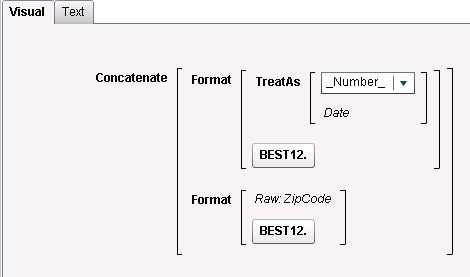
- Create a new calculated data item that concatenates all of the data items used in the geo map. The new data item is named MyUnique. The data items must first be converted to character values. Here is what the expression looks like:
- In the Data pane, right-click MyUnique and select Create Distinct Count. The new data item is named MyUnique (Distinct Count).
- Add a list table to your report and include only the MyUnique (Distinct Count) data item. The list table shows you how many rows are in your unfiltered result set. In this case, there are 75,600 rows.
- Add a range slider to the section or report prompt area so that it automatically filters both the table and the geo map. Assign the date to the slider.
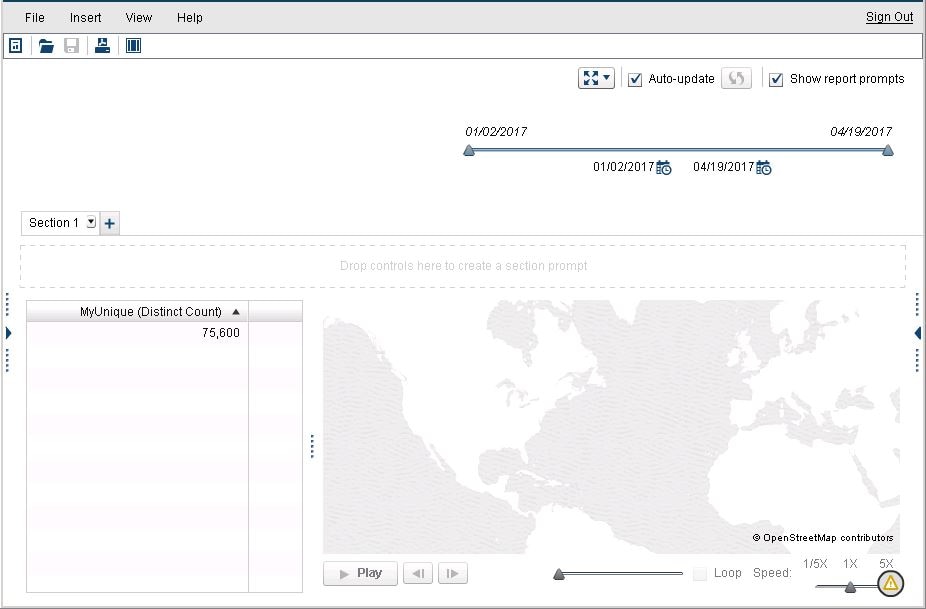
Without filtering, notice that the geo map shows the warning badge in the lower right corner.
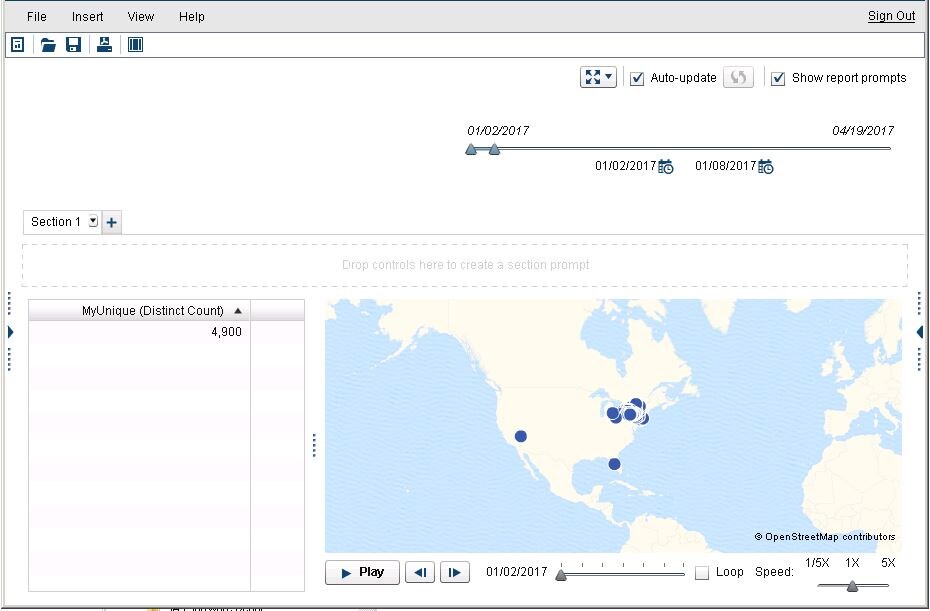
- Adjust the range slider until the geo map displays, which it does as soon as the list table confirms that there are less than 5,000 unique values. You now know the date range that you must use in order to apply animation to the geo map.
Operating System and Release Information
| Product Family | Product | System | Product Release | SAS Release | ||
| Reported | Fixed* | Reported | Fixed* | |||
| SAS System | SAS Visual Analytics | Microsoft® Windows® for x64 | 7.3 | 9.4 TS1M3 | ||
| Linux for x64 | 7.3 | 9.4 TS1M3 | ||||
| Type: | Usage Note |
| Priority: |
| Date Modified: | 2017-05-05 09:51:55 |
| Date Created: | 2017-04-21 15:58:25 |