Sample 53766: Automatic Aggregation and Time-Series Analysis with SAS In-Memory Statistics for Hadoop
 |  |  |  |  |  |
An accurate forecast is very critical for making right business decisions. In the era of big data, massive amount of data can help dramatically to make the forecast more precise. However, it is also very challenging that forecasts based on big data requires software to be fast, scalable, as well as possess strong statistical predictive ability. The FORECAST statement of SAS In-Memory Statistics for Hadoop(PROC IMSTAT) can meet that challenge by scaling to meet the size of the data and perform the analysis, start to finish, in memory. You not only get the strong statistical backing of SAS, but also you have the productivity enhancement of being able to perform more forecasts and achieve more accurate forecasts.
The FORECAST statement of PROC IMSTAT can aggregate and analyze time series data in the LASR server. It offers the ability to aggregate the analysis variables according to the unique values of time-stamped-variable, such as date, month, year and other time formats supported by SAS. Time series analysis abilities includes, but not limited to, computing predicted values, standard error of prediction, and confidence limits for past and future (forecast) values of time series. FORECAST statement is also capable of goal-seeking and auto-modeling by performing automatic model selection and automatic variable selection. The candidate models include exponential smoothing and ARIMA model families.
The following example demonstrates the use of the FORECAST statement of PROC IMSTAT to aggregate data, automatically select a time series model, fit the model and perform prediction. The example uses a data set, megacorp1m, which has 11592 observations. The data set is about the operational status of a refinery plant that has three product lines. It includes daily data from all of the plants between 01/01/2001 and 07/31/2011. There are 3 observations on each date, because each product line provides an observation each day. The daily observations are aggregated by date in the example.
These sample files and code examples are provided by SAS Institute Inc. "as is" without warranty of any kind, either express or implied, including but not limited to the implied warranties of merchantability and fitness for a particular purpose. Recipients acknowledge and agree that SAS Institute shall not be liable for any damages whatsoever arising out of their use of this material. In addition, SAS Institute will provide no support for the materials contained herein.
/* Start a LASR Analytic Server */
option set=GRIDHOST="grid001.example.com";
option set=GRIDINSTALLLOC="/opt/TKGrid";
%let myport = 10010;
proc lasr create port=&myport path="/tmp/";
    performance nodes = all;
run;

/* Load the daily observations to memory */
libname hdfs sashdat path="/user/data";
proc lasr add data = hdfs.megacorp1m port=&myport;
    performance nodes = all;
run;

/* Assign a libref to access tables in the server */
libname mylasr sasiola tag='USER.DATA' port=&myport;

/* Start PROC IMSTAT to analyze the data */
proc imstat;
/* Fetch the first 20 obs */
    table mylasr.megacorp1m;
    fetch/format orderby=date;
run;
/* Aggregate the analysis variable profit by date */
/* Conduct an ordinary time series analysis without independent variables. */
/* Perform automatic model selection to select the best-fitting time series model.*/
/* Predict 100 days after the end date of data*/
/* Output the result ODS table to make forecast plot */
    table mylasr.megacorp1m;
    forecast date /
        vars = (profit) aggregate = (sum)
        lead = 100 info;
    ods output forecast = work.forecastresult;
run;
quit;

proc sgplot data=work.forecastresult;
    band x=date lower=lower upper=upper;
    series x=date y=actual/lineattrs=(color=blue);
    series x=date y=predict/lineattrs=(color=red);
    format lower DOLLAR12.
           upper DOLLAR12.
           actual DOLLAR12.
           predict DOLLAR12.
           date MMDDYY10.
;
run;
/* Stop the LASR server */
proc lasr term port = &myport;
run;
These sample files and code examples are provided by SAS Institute Inc. "as is" without warranty of any kind, either express or implied, including but not limited to the implied warranties of merchantability and fitness for a particular purpose. Recipients acknowledge and agree that SAS Institute shall not be liable for any damages whatsoever arising out of their use of this material. In addition, SAS Institute will provide no support for the materials contained herein.
Fetch the first 20 observations of the input data set. 20 is the default observation number in FETCH statement.Model Information. A damped-trend expoential smoothing model is automatically selected by FORECAST statement. The table is requested by INFO option.
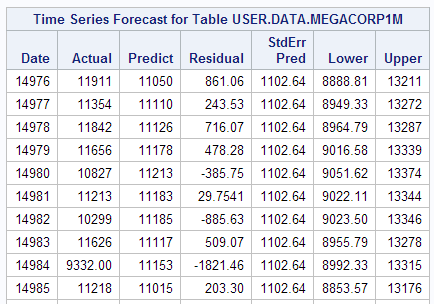
Forecast Result. It includes actual values, predicted values, residual, standard error of prediction, the lower and upper bound of 95% confidence interval.
 < and so on >
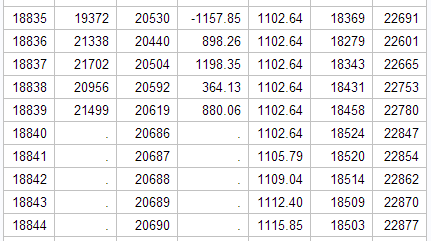 < and so on >
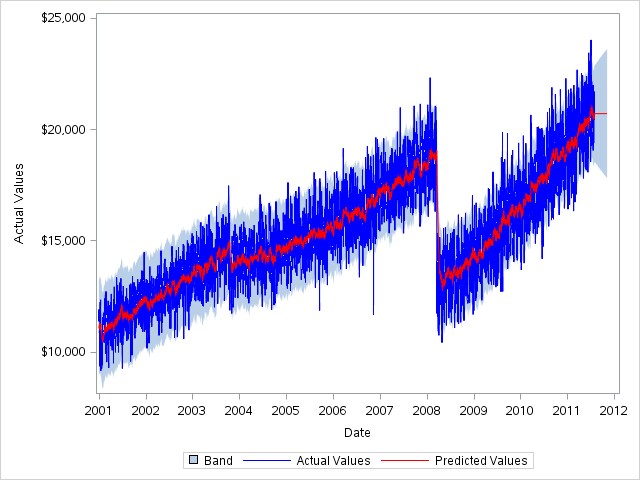
Forecast Plot
| Type: | Sample |
| Topic: | Analytics ==> Econometrics Analytics ==> Forecasting Analytics ==> Time Series Analysis |
| Date Modified: | 2014-07-29 15:45:36 |
| Date Created: | 2014-07-28 10:04:46 |
Operating System and Release Information
| Product Family | Product | Host | Product Release | SAS Release | ||
| Starting | Ending | Starting | Ending | |||
| SAS System | SAS In-Memory Statistics for Hadoop | Solaris for x64 | 2.2 | 9.4 TS1M2 | ||
| Linux for x64 | 2.2 | 9.4 TS1M2 | ||||
| 64-bit Enabled Solaris | 2.2 | 9.4 TS1M2 | ||||
| 64-bit Enabled AIX | 2.2 | 9.4 TS1M2 | ||||
| Microsoft® Windows® for x64 | 2.2 | 9.4 TS1M2 | ||||
| SAS System | SAS LASR Analytic Server | Microsoft® Windows® for x64 | 2.3_M1 | 9.4 TS1M2 | ||
| 64-bit Enabled AIX | 2.3_M1 | 9.4 TS1M2 | ||||
| 64-bit Enabled Solaris | 2.3_M1 | 9.4 TS1M2 | ||||
| Linux for x64 | 2.3_M1 | 9.4 TS1M2 | ||||
| Solaris for x64 | 2.3_M1 | 9.4 TS1M2 | ||||