Sample 52648: Display multiple axis scales and label plot points with PROC GPLOT
 |  |  |  |  |
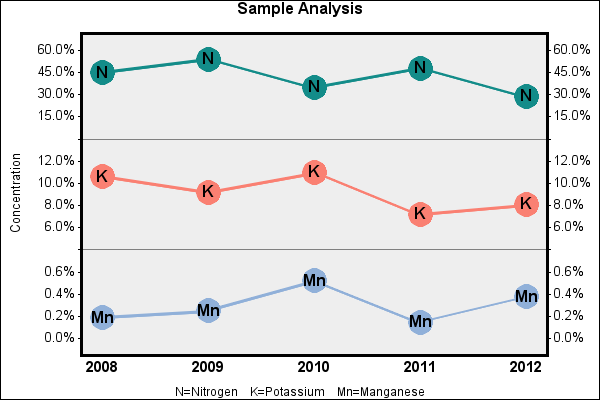
The sample code on the Full Code tab illustrates two SAS/GRAPH® programming techniques with the GPLOT procedure: displaying multiple scales on a single set of plot axes, and labeling the plot points without using the Annotate facility. By using the options available on global statements, you can customize your graphics output in a variety of different ways.
These sample files and code examples are provided by SAS Institute Inc. "as is" without warranty of any kind, either express or implied, including but not limited to the implied warranties of merchantability and fitness for a particular purpose. Recipients acknowledge and agree that SAS Institute shall not be liable for any damages whatsoever arising out of their use of this material. In addition, SAS Institute will provide no support for the materials contained herein.
The sample code below illustrates two SAS/GRAPH® programming techniques with the GPLOT procedure: displaying multiple scales on a single set of plot axes, and labeling the plot points without using the Annotate facility. By using the options available on global statements, you can customize your graphics output in a variety of different ways.
/* Set the graphics environment */
goptions reset=all cback=white border htext=10pt htitle=12pt;

/* Create data to plot */
data samples;
   input year mn n k;
   datalines;
2008  0.19  45  10.6
2009  0.25  54  9.2
2010  0.52  35  11.0
2011  0.15  48  7.2
2012  0.38  29  8.1
;
run;

/* Create a format to display the data values with percent signs */
proc format;
   picture pctfmt low - high = '009.9%';
run;

/* Define the title */
title1 "Sample Analysis";

/* The FOOTNOTE statement creates a legend */
footnote1 height=9pt 'N=Nitrogen    K=Potassium    Mn=Manganese';

/* Create the AXIS definitions that draw a thick border around the */
/* plot area and display multiple scales on the vertical axes      */
axis1 order=(2008 to 2012 by 1)
      value=(font='Arial/bold' height=11pt)
      offset=(4,4)
      width=2
      label=none
      major=none
      minor=none;
axis2 order=(0 to .6 by .2, 3, 6 to 12 by 2, 13, 15 to 60 by 15)
      label=(angle=90 'Concentration')
      value=(tick=5 ' ' tick=10 ' ')
      offset=(2,2);
axis3 order=(0 to .6 by .2, 3, 6 to 12 by 2, 13, 15 to 60 by 15)
      label=none
      value=(tick=5 ' ' tick=10 ' ')
      offset=(2,2);

/* Define the symbol characteristics */

/* SYMBOL1-SYMBOL3 draw a dot at each point */
/* and connect the points with a line.    */
symbol1 interpol=join width=2 color=vligb  value=dot height=6;
symbol2 interpol=join width=2 color=salmon value=dot height=6;
symbol3 interpol=join width=2 color=vibg   value=dot height=6;

/* SYMBOL4-SYMBOL6 are used with the PLOT2 statement and display the */
/* character symbol of the corresponding element for each point  */
symbol4 interpol=none value='Mn' font='Arial/bold' color=black height=12pt;
symbol5 interpol=none value='K'  font='Arial/bold' color=black height=12pt;
symbol6 interpol=none value='N'  font='Arial/bold' color=black height=12pt;

/* Generate the graph */
proc gplot data=samples;
   plot (mn k n)*year / overlay haxis=axis1 vaxis=axis2
                        vref=3 13 cframe=grayee;
   plot2 (mn k n)*year / overlay vaxis=axis3;
   format mn k n pctfmt.;
run;
quit;
These sample files and code examples are provided by SAS Institute Inc. "as is" without warranty of any kind, either express or implied, including but not limited to the implied warranties of merchantability and fitness for a particular purpose. Recipients acknowledge and agree that SAS Institute shall not be liable for any damages whatsoever arising out of their use of this material. In addition, SAS Institute will provide no support for the materials contained herein.
By using the options available on global statements, you can customize your graphics output in a variety of different ways.
| Type: | Sample |
| Topic: | SAS Reference ==> Procedures ==> GPLOT Query and Reporting ==> Creating Reports ==> Graphical ==> Graph Types ==> Plots ==> Line |
| Date Modified: | 2014-03-26 15:57:12 |
| Date Created: | 2014-03-26 15:14:18 |
Operating System and Release Information
| Product Family | Product | Host | SAS Release | |
| Starting | Ending | |||
| SAS System | SAS/GRAPH | z/OS | 9.2 TS1M0 | |
| Microsoft® Windows® for 64-Bit Itanium-based Systems | 9.2 TS1M0 | |||
| Microsoft Windows Server 2003 Datacenter 64-bit Edition | 9.2 TS1M0 | |||
| Microsoft Windows Server 2003 Enterprise 64-bit Edition | 9.2 TS1M0 | |||
| Microsoft Windows XP 64-bit Edition | 9.2 TS1M0 | |||
| Microsoft® Windows® for x64 | 9.2 TS1M0 | |||
| Microsoft Windows Server 2003 Datacenter Edition | 9.2 TS1M0 | |||
| Microsoft Windows Server 2003 Enterprise Edition | 9.2 TS1M0 | |||
| Microsoft Windows Server 2003 Standard Edition | 9.2 TS1M0 | |||
| Microsoft Windows XP Professional | 9.2 TS1M0 | |||
| Windows Vista | 9.2 TS1M0 | |||
| Windows Vista for x64 | 9.2 TS1M0 | |||
| 64-bit Enabled AIX | 9.2 TS1M0 | |||
| 64-bit Enabled HP-UX | 9.2 TS1M0 | |||
| 64-bit Enabled Solaris | 9.2 TS1M0 | |||
| HP-UX IPF | 9.2 TS1M0 | |||
| Linux | 9.2 TS1M0 | |||
| Linux for x64 | 9.2 TS1M0 | |||
| OpenVMS on HP Integrity | 9.2 TS1M0 | |||
| Solaris for x64 | 9.2 TS1M0 | |||