Problem Note 52303: Upper and lower control limits might be missing from a Trend/Control analysis chart that was created with SAS® Warranty Analysis
When you run a Trend/Control analysis in SAS Warranty Analysis, the Upper Chart Limit (UCL) and Lower Chart Limit(LCL) are not visible when the control chart limit values are not part of the data range.
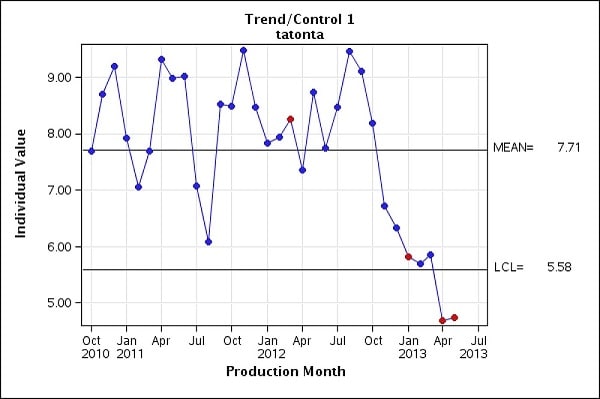
Note: (The graph above should have a UCL line and value as well as an LCL line and value.)
Click the Hot Fix tab in this note to access the hot fix for this issue.
Operating System and Release Information
| SAS System | SAS Warranty Analysis | Microsoft® Windows® for x64 | 4.31 | | 9.3 TS1M2 | |
| 64-bit Enabled AIX | 4.31 | | 9.3 TS1M2 | |
| 64-bit Enabled Solaris | 4.31 | | 9.3 TS1M2 | |
| HP-UX IPF | 4.31 | | 9.3 TS1M2 | |
| Linux for x64 | 4.31 | | 9.3 TS1M2 | |
*
For software releases that are not yet generally available, the Fixed
Release is the software release in which the problem is planned to be
fixed.
The control chart limits (UCL and LCL) are not seen in a Trend/Control analysis when control chart limit values are not part of the data range.
| Type: | Problem Note |
| Priority: | high |
| Date Modified: | 2014-03-07 14:30:42 |
| Date Created: | 2014-02-11 13:06:21 |


