Sample 49301: Annotate a logarithmic axis with PROC SGPLOT
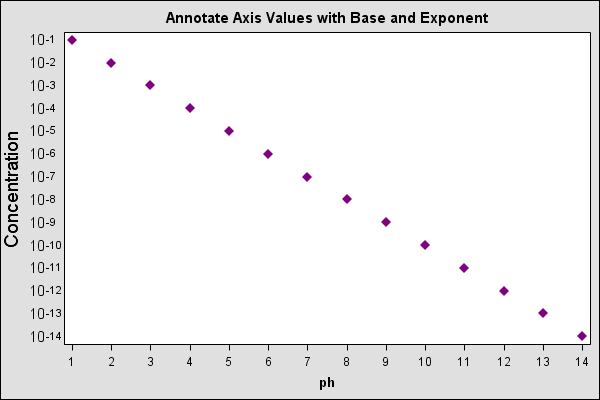
The SGPLOT procedure enables you to create logarithmic axes with the axis tick marks displayed as the power of the base or the exponent of the power of the base. In order to display the base with the exponent, SG Annotation can be used to place the values on the graph.
The sample code on the Full Code tab shows how to annotate the values on the graph. Note that the SGPLOT procedure automatically thins (removes) values from the axis when values might overwrite. The annotation does not have the ability to detect that values were thinned, so the annotation places values on the graph that might not include associated tick marks.
These sample files and code examples are provided by SAS Institute
Inc. "as is" without warranty of any kind, either express or implied, including
but not limited to the implied warranties of merchantability and fitness for a
particular purpose. Recipients acknowledge and agree that SAS Institute shall
not be liable for any damages whatsoever arising out of their use of this material.
In addition, SAS Institute will provide no support for the materials contained herein.
The sample code below uses SG Annotation with the SGPLOT procedure to output a logarithmic axis with exponents.
data concentr;
   input ph conc;
   datalines;
1  1E-1
2  1E-2
3  1E-3
4  1E-4
5  1E-5
6  1E-6
7  1E-7
8  1E-8
9  1E-9
10 1E-10
11 1E-11
12 1E-12
13 1E-13
14 1E-14
;
run;

data sganno;
   length label $20 x1space y1space $11 anchor $8;
   retain y1space 'datavalue' x1space 'wallpercent' textcolor 'black'
   width 25;
   set concentr end=last;
   x1=-3;
   y1=conc;
   function='text';
   label=strip('10');
   textsize=12;
   anchor='right';
   output;
   x1=-4;
   label=strip(log10(conc));
   textsize=8;
   anchor='left';
   output;
   if last then do;
      x1=-10;
      y1space='wallpercent';
      y1=50;
      label='Concentration';
      rotate=90;
      textsize=14;
      anchor='center';
      output;
   end;
run;

title 'Annotate Axis Values with Base and Exponent';

proc sgplot data=concentr pad=(left=15%) sganno=sganno;
   scatter y=conc x=ph / markerattrs=(symbol=diamondfilled color=cx800080);
   xaxis type=discrete;
   yaxis type=log logbase=10 logstyle=logexpand display=(novalues nolabel noticks);
run;
These sample files and code examples are provided by SAS Institute
Inc. "as is" without warranty of any kind, either express or implied, including
but not limited to the implied warranties of merchantability and fitness for a
particular purpose. Recipients acknowledge and agree that SAS Institute shall
not be liable for any damages whatsoever arising out of their use of this material.
In addition, SAS Institute will provide no support for the materials contained herein.

This sample uses SG Annotation with the SGPLOT procedure to output a logarithmic axis with exponents. Note that because the procedure thins axis values automatically, the annotation might place labels that the procedure has removed.
| Type: | Sample |
| Topic: | SAS Reference ==> Procedures ==> SGPLOT
|
| Date Modified: | 2013-03-22 10:48:23 |
| Date Created: | 2013-02-28 08:51:10 |
Operating System and Release Information
| SAS System | Base SAS | Aster Data nCluster on Linux x64 | 9.3 TS1M1 | |
| DB2 Universal Database on AIX | 9.3 TS1M1 | |
| DB2 Universal Database on Linux x64 | 9.3 TS1M1 | |
| Greenplum on Linux x64 | 9.3 TS1M1 | |
| Netezza TwinFin 32bit blade | 9.3 TS1M1 | |
| Netezza TwinFin 32-bit SMP Hosts | 9.3 TS1M1 | |
| Netezza TwinFin 64-bit S-Blades | 9.3 TS1M1 | |
| Netezza TwinFin 64-bit SMP Hosts | 9.3 TS1M1 | |
| Teradata on Linux | 9.3 TS1M1 | |
| z/OS | 9.3 TS1M1 | |
| Z64 | 9.3 TS1M1 | |
| Microsoft® Windows® for x64 | 9.3 TS1M1 | |
| Microsoft Windows Server 2003 Datacenter Edition | 9.3 TS1M1 | |
| Microsoft Windows Server 2003 Enterprise Edition | 9.3 TS1M1 | |
| Microsoft Windows Server 2003 Standard Edition | 9.3 TS1M1 | |
| Microsoft Windows Server 2003 for x64 | 9.3 TS1M1 | |
| Microsoft Windows Server 2008 | 9.3 TS1M1 | |
| Microsoft Windows Server 2008 for x64 | 9.3 TS1M1 | |
| Microsoft Windows XP Professional | 9.3 TS1M1 | |
| Windows 7 Enterprise 32 bit | 9.3 TS1M1 | |
| Windows 7 Enterprise x64 | 9.3 TS1M1 | |
| Windows 7 Home Premium 32 bit | 9.3 TS1M1 | |
| Windows 7 Home Premium x64 | 9.3 TS1M1 | |
| Windows 7 Professional 32 bit | 9.3 TS1M1 | |
| Windows 7 Professional x64 | 9.3 TS1M1 | |
| Windows 7 Ultimate 32 bit | 9.3 TS1M1 | |
| Windows 7 Ultimate x64 | 9.3 TS1M1 | |
| Windows Vista | 9.3 TS1M1 | |
| Windows Vista for x64 | 9.3 TS1M1 | |
| 64-bit Enabled AIX | 9.3 TS1M1 | |
| 64-bit Enabled HP-UX | 9.3 TS1M1 | |
| 64-bit Enabled Solaris | 9.3 TS1M1 | |
| HP-UX IPF | 9.3 TS1M1 | |
| Linux | 9.3 TS1M1 | |
| Linux for x64 | 9.3 TS1M1 | |
| Solaris for x64 | 9.3 TS1M1 | |


