Sample 44129: Split axis values across multiple lines with the Graph Template Language (GTL)
 |  |  |  |  |
This sample uses the SAS® 9.3 DRAWTEXT statements in the Graph Template Language (GTL) to split axis values across multiple lines.
Note that the null ENTRYFOOTNOTE statement sets the size of the text to 30 in order to assure that there is enough space below the graph for the annotation. The annotation draws the axis values and the axis label.
These sample files and code examples are provided by SAS Institute Inc. "as is" without warranty of any kind, either express or implied, including but not limited to the implied warranties of merchantability and fitness for a particular purpose. Recipients acknowledge and agree that SAS Institute shall not be liable for any damages whatsoever arising out of their use of this material. In addition, SAS Institute will provide no support for the materials contained herein.
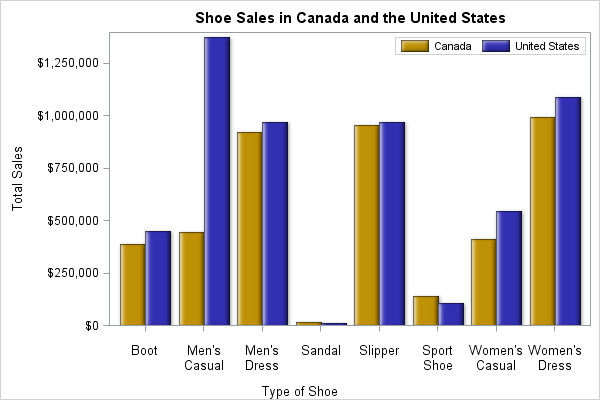
This sample uses the SAS® 9.3 DRAWTEXT statements in the Graph Template Language (GTL) to split axis values across multiple lines.
Note that the null ENTRYFOOTNOTE statement sets the size of the text to 30 in order to assure that there is enough space below the graph for the annotation. The annotation draws the axis values and the axis label.
proc template;
   define statgraph drawtext;
   begingraph;
      entrytitle 'Shoe Sales in Canada and the United States';
      entryfootnote ' ' / textattrs=(size=30);
      layout overlay / xaxisopts=(display=(line ticks));
         barchart x=product y=sales / group=region groupdisplay=cluster name='region'
                                      dataskin=sheen;
         drawtext 'Sandal' / x='Sandal' y=-5 anchor=top justify=center xspace=datavalue yspace=datapercent width=15;
         drawtext 'Boot' / x='Boot' y=-5 anchor=top justify=center xspace=datavalue yspace=datapercent width=15;
         drawtext 'Slipper' / x='Slipper' y=-5 anchor=top justify=center xspace=datavalue yspace=datapercent width=15;
         drawtext 'Sport Shoe' / x='Sport Shoe' y=-5 anchor=top justify=center xspace=datavalue yspace=datapercent width=15;
         drawtext "Men's Dress" / x="Men's Dress" y=-5 anchor=top justify=center xspace=datavalue yspace=datapercent width=15;
         drawtext "Women's Casual" / x="Women's Casual" y=-5 anchor=top justify=center xspace=datavalue yspace=datapercent width=15;
         drawtext "Women's Dress" / x="Women's Dress" y=-5 anchor=top justify=center xspace=datavalue yspace=datapercent width=15;
         drawtext "Men's Casual" / x="Men's Casual" y=-5 anchor=top justify=center xspace=datavalue yspace=datapercent width=15;
         drawtext 'Type of Shoe' / x=50 y=2 justify=center xspace=graphpercent yspace=graphpercent width=30;
         discretelegend 'region' / location=inside halign=right valign=top;
      endlayout;
   endgraph;
   end;

   define style styles.barcolor;
   parent=styles.htmlblue;
      class GraphData1 / color=VIOY;
      class GraphData2 / color=BIB;
   end;
run;

proc sort data=sashelp.shoes out=shoes;
   by product;
run;

ods html style=styles.barcolor;

proc sgrender data=shoes template=drawtext;
   where region in('United States' 'Canada');
run;
These sample files and code examples are provided by SAS Institute Inc. "as is" without warranty of any kind, either express or implied, including but not limited to the implied warranties of merchantability and fitness for a particular purpose. Recipients acknowledge and agree that SAS Institute shall not be liable for any damages whatsoever arising out of their use of this material. In addition, SAS Institute will provide no support for the materials contained herein.
This sample uses the SAS® 9.3 DRAWTEXT statements in the Graph Template Language (GTL) to split axis values across multiple lines.
| Type: | Sample |
| Topic: | Query and Reporting ==> Creating Reports ==> Graphical ==> Graph Template Language (GTL) SAS Reference ==> Procedures ==> SGRENDER |
| Date Modified: | 2011-10-18 09:57:38 |
| Date Created: | 2011-08-26 14:53:31 |
Operating System and Release Information
| Product Family | Product | Host | SAS Release | |
| Starting | Ending | |||
| SAS System | Base SAS | z/OS | 9.3 TS1M0 | |
| Z64 | 9.3 TS1M0 | |||
| Microsoft® Windows® for x64 | 9.3 TS1M0 | |||
| Microsoft Windows Server 2003 Datacenter Edition | 9.3 TS1M0 | |||
| Microsoft Windows Server 2003 Enterprise Edition | 9.3 TS1M0 | |||
| Microsoft Windows Server 2003 Standard Edition | 9.3 TS1M0 | |||
| Microsoft Windows Server 2003 for x64 | 9.3 TS1M0 | |||
| Microsoft Windows Server 2008 | 9.3 TS1M0 | |||
| Microsoft Windows Server 2008 for x64 | 9.3 TS1M0 | |||
| Microsoft Windows XP Professional | 9.3 TS1M0 | |||
| Windows 7 Enterprise 32 bit | 9.3 TS1M0 | |||
| Windows 7 Enterprise x64 | 9.3 TS1M0 | |||
| Windows 7 Home Premium 32 bit | 9.3 TS1M0 | |||
| Windows 7 Home Premium x64 | 9.3 TS1M0 | |||
| Windows 7 Professional 32 bit | 9.3 TS1M0 | |||
| Windows 7 Professional x64 | 9.3 TS1M0 | |||
| Windows 7 Ultimate 32 bit | 9.3 TS1M0 | |||
| Windows 7 Ultimate x64 | 9.3 TS1M0 | |||
| Windows Vista | 9.3 TS1M0 | |||
| Windows Vista for x64 | 9.3 TS1M0 | |||
| 64-bit Enabled AIX | 9.3 TS1M0 | |||
| 64-bit Enabled HP-UX | 9.3 TS1M0 | |||
| 64-bit Enabled Solaris | 9.3 TS1M0 | |||
| HP-UX IPF | 9.3 TS1M0 | |||
| Linux | 9.3 TS1M0 | |||
| Linux for x64 | 9.3 TS1M0 | |||
| Solaris for x64 | 9.3 TS1M0 | |||