Sample 43731: Create a graph with PROC SGPLOT with colors defined using an attribute map
The sample code on the Full Code tab uses an attribute map with PROC SGPLOT to associate a specific data value with a fill color for the graph. This sample code requires SAS® 9.3 or higher.
These sample files and code examples are provided by SAS Institute
Inc. "as is" without warranty of any kind, either express or implied, including
but not limited to the implied warranties of merchantability and fitness for a
particular purpose. Recipients acknowledge and agree that SAS Institute shall
not be liable for any damages whatsoever arising out of their use of this material.
In addition, SAS Institute will provide no support for the materials contained herein.
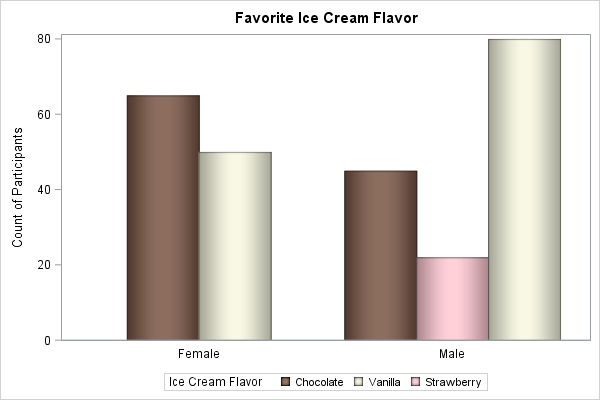
This sample uses an attribute map with PROC SGPLOT to associate a specific data value with a fill color for the graph. This sample code requires SAS 9.3 or higher.
The graphics output on the
Results tab was produced using SAS
® 9.4. Submitting the sample code with releases of SAS prior to SAS 9.4 might produce different results.
/* Define sample data of ice cream flavor
   preferences for Males and Females */
data icecream;
   input flavor $10. sex $ count;
   datalines;
Vanilla    M 80
Chocolate  M 45
Strawberry M 22
Chocolate  F 65
Vanilla    F 50
;
run;

/* Define an attribute map to associate specific fill colors
   with data values */
data attrmap;
   /* The ID required variable contains the name of the attribute map */
   /* The VALUE required variable contains the value of the GROUP variable,
      which in this case is FLAVOR */
   /* The FILLCOLOR variable is used to change the color for the bars created by the VBAR
      statement. */

   input id $ value $10. @19 fillcolor $8.;
   datalines;
flavor Vanilla    beige
flavor Chocolate  cx663D29
flavor Strawberry pink
;
run;

/* Define a format for the SEX variable */
proc format;
   value $ fmt
      'F'='Female'
      'M'='Male';
run;

title 'Favorite Ice Cream Flavor';

/* The DATTRMAP option references the attribute map data set */
proc sgplot data=icecream dattrmap=attrmap;
   format sex $fmt.;
   /* The ATTRID option references the name of the attribute map */
   vbar sex / group=flavor response=count groupdisplay=cluster
              dataskin=pressed attrid=flavor;
   xaxis display=(nolabel noticks);
   yaxis label='Count of Participants';
   keylegend / title='Ice Cream Flavor';
run;
These sample files and code examples are provided by SAS Institute
Inc. "as is" without warranty of any kind, either express or implied, including
but not limited to the implied warranties of merchantability and fitness for a
particular purpose. Recipients acknowledge and agree that SAS Institute shall
not be liable for any damages whatsoever arising out of their use of this material.
In addition, SAS Institute will provide no support for the materials contained herein.
This sample uses an attribute map with PROC SGPLOT to associate a specific data value with a fill color for the graph. This sample code requires SAS
® 9.3 or higher.
| Type: | Sample |
| Topic: | SAS Reference ==> Procedures ==> SGPLOT
|
| Date Modified: | 2011-11-03 10:47:23 |
| Date Created: | 2011-07-13 09:29:04 |
Operating System and Release Information
| SAS System | Base SAS | z/OS | 9.3 TS1M0 | |
| Z64 | 9.3 TS1M0 | |
| Microsoft® Windows® for x64 | 9.3 TS1M0 | |
| Microsoft Windows Server 2003 Datacenter Edition | 9.3 TS1M0 | |
| Microsoft Windows Server 2003 Enterprise Edition | 9.3 TS1M0 | |
| Microsoft Windows Server 2003 Standard Edition | 9.3 TS1M0 | |
| Microsoft Windows Server 2003 for x64 | 9.3 TS1M0 | |
| Microsoft Windows Server 2008 | 9.3 TS1M0 | |
| Microsoft Windows Server 2008 for x64 | 9.3 TS1M0 | |
| Microsoft Windows XP Professional | 9.3 TS1M0 | |
| Windows 7 Enterprise 32 bit | 9.3 TS1M0 | |
| Windows 7 Enterprise x64 | 9.3 TS1M0 | |
| Windows 7 Home Premium 32 bit | 9.3 TS1M0 | |
| Windows 7 Home Premium x64 | 9.3 TS1M0 | |
| Windows 7 Professional 32 bit | 9.3 TS1M0 | |
| Windows 7 Professional x64 | 9.3 TS1M0 | |
| Windows 7 Ultimate 32 bit | 9.3 TS1M0 | |
| Windows 7 Ultimate x64 | 9.3 TS1M0 | |
| Windows Vista | 9.3 TS1M0 | |
| Windows Vista for x64 | 9.3 TS1M0 | |
| 64-bit Enabled AIX | 9.3 TS1M0 | |
| 64-bit Enabled HP-UX | 9.3 TS1M0 | |
| 64-bit Enabled Solaris | 9.3 TS1M0 | |
| HP-UX IPF | 9.3 TS1M0 | |
| Linux | 9.3 TS1M0 | |
| Linux for x64 | 9.3 TS1M0 | |
| Solaris for x64 | 9.3 TS1M0 | |


