Sample 41683: Gains and Lift plots for binary-response models
 |  |  |  |  |
Gains and Lift plots for binary-response models
| Contents: | Purpose / History / Requirements / Usage / Details / Limitations / Missing Values |
- PURPOSE:
- The GainLift macro produces a Gains plot and cumulative and noncumulative plots of the following statistics for a binary-response model such as a logistic or probit model:
- Lift
- Percent Captured
- Percent Response
All plots can be displayed in a single panel or plots can be individually presented.
- HISTORY:
- The version of the GainLift macro that you are using is displayed in the SAS® log when you specify version (or any string) as the first argument. For example:
%GainLift(version, <other macro options>)The GainLift macro always attempts to check for a later version of itself. If it is unable to do this (such as if there is no active internet connection available), the macro will issue the following message:
GainLift: Unable to check for newer version
The computations performed by the macro are not affected by the appearance of this message.
Version Update Notes 1.1 Corrected gain formula to use absolute value. Removed cumulative gain. Added Best possible values for each statistic. Added default table of statistics. Added GRAPHOPTS= option that subsumes previous GRAPH, GRID= and PANEL= options and adds capability for displaying baseline and best possible lines. Added TABLEOPTS option that controls whether statistics table is presented and presence of baseline and best possible columns. Replaced ONEPLOT= option with PLOTS= option to specify any subset of the plots for display. Now displays notes in the log for time used and output data set creation. 1.0 Initial version - REQUIREMENTS:
- Base SAS®
- USAGE:
- Follow the instructions in the Downloads tab of this sample to save the GainLift macro definition. In your SAS program or in the SAS editor window, specify the following statement to define the GainLift macro and make it available for use. Replace the text within quotes with the location of the GainLift macro definition file on your system.
%inc "<location of your file containing the GainLift macro>";
Following this statement, you can call the GainLift macro using the following syntax. Macro arguments can be listed in any order.
%GainLift(<list of macro arguments separated by commas>)
See the Results tab for an example.
The following macro arguments are required:
- response=variable-name
- Specifies the name of the variable containing the observed response values. This is typically the variable specified to the left of the equal sign in the MODEL statement of procedures such as LOGISTIC, GENMOD, and PROBIT.
- event=value | "value" | 'value'
- Specifies the value of the response variable which represents the event level that was modeled. If the RESPONSE= variable is a character variable, value must be enclosed in quotes.
- p=variable-name
- Specifies the name of the variable containing the predicted event probabilities produced by the model. This variable is typically produced by the P= option in the OUTPUT statement of procedures such as LOGISTIC, GENMOD, and PROBIT.
The following macro arguments are optional:
- data=SAS-data-set
- Specifies the name of the data set containing observed response values and predicted probabilities from the fitted model. This data set is typically produced by the OUT= option in the OUTPUT statement of procedures such as LOGISTIC, GENMOD, and PROBIT. If not specified, the data set last created is used.
- tableopts=values
- Specify any of the following, separated by spaces: TABLE, to produce a table showing statistics for each decile or demi-decile group, NOTABLE, to omit the table of statistics, BASE, to show the baseline (case of an uninformative model), NOBASE, to omit the baseline case, BEST, to show the best possible case, NOBEST, to omit the best possible case. The default is TABLEOPTS=TABLE NOBASE NOBEST.
- graphopts=values
- Specify any of the following, separated by spaces: NOGRAPH, suppresses all plots, LINE, produces line plots, BAR, produces bar charts, PANEL, plots all statistics in a panel, NOPANEL, plots all statistics in separate plots, GRID, adds grid lines in plots, NOGRID, omits grid lines, BASE, shows the baseline case (uninformative model), NOBASE, omits the baseline case, BEST, shows the best possible case, NOBEST, omits the best possible case. The default is GRAPHOPTS=LINE PANEL GRID BEST BASE.
- groups=20 | 10
- Specifies the number of groups produced from the predicted event probabilities. By default, 20 groups (demi-deciles) are produced. GROUPS=10 produces deciles.
- plots=CGAIN | GAIN | CLIFT | LIFT | CCAPT | PCAPT | CRESP | PRESP
- Requests a individual, full-size plots rather than a panel of all seven plots. Specify one or more of the following, separated by spaces: CGAIN (cumulative gains), GAIN (gains), CLIFT (cumulative lift), LIFT (lift), CCAPT (cumulative percent captured), PCAPT (percent captured), CRESP (cumulative percent response), or PRESP (percent response).
- xaxis=SelectedPCT | Percentile | GroupNum
- The default XAXIS=SelectedPct displays the selected percentile values of the predicted probability groups on the horizontal axis (labeled Depth). The group with the highest predicted probability has the lowest depth. The group with depth 100 has the lowest predicted probability. The opposite is true when XAXIS=Percentile since the groups with the lowest predicted probability has the lowest percentile. Group numbers are displayed when XAXIS=GroupNum. Group 1 has highest predicted probability.
- out=SAS-data-set
- Names the data set created by the macro which contains the statistics needed to generate the plots. If not specified, the data set is named _GainLift.
- DETAILS:
- The plots produced by the GainLift macro are commonly used to assess the predictive ability of a binary response model, such as a logistic or probit model or of a decision tree. Gains and lift plots are popular in direct marketing and credit scoring fields. Another plot, the ROC plot, also summarizes predictive ability. The ROC plot can be produced directly by the LOGISTIC procedure.
The gains plot shows the percent difference between the overall proportion of events and the observed proportion of events in all groups up to the current group. The lift plot gives, for each group, the ratio of the proportion of observations in the group that are events to the overall proportion of events. The cumulative lift plot gives event rate up to the current group over the overall event rate. The percent captured plot gives, for each group, the percentage of total events in the group. The cumulative percent captured plots gives the percentage of total events up to the current group. The percent response plot gives the percentage of observations in the group that are events. The cumulative percent response plot gives the percentage of observations up to the current group that are events.
The statistics are computed as follows:
   E  = total number of events
   N  = number of observations
   G  = number of groups (10 for deciles or 20 for demi-deciles)
   P  = overall proportion of observations that are events (P = E/N)
   ei = number of events in group i, i=1,2,...,G
   bi = best event count achievable in group i, i=1,2,...,G
      = E-Σjej if E-Σjej≤ni, = ni otherwise, where j=1,2,...,i-1
   ni = number of observations in group i
   pi = proportion of observations in group i that are events (pi = ei/ni)

   %Response = 100*pi
   Cumulative %Response = 100*Σiei/Σini
   %Captured = 100*ei/E
   Cumulative %Captured = 100*Σiei/E
   Lift = pi/P
   Cumulative Lift = (Σiei/Σini)/P
   Gain = 100*abs(Cumulative Lift-1)
The best possible statistic values for a model are computed as above using the best event count achievable, bi, rather than ei. This puts all observed events in the top decile or demi-decile groups, filling the top groups as needed to absorb all observed events.
Assuming an uninformative model which randomly puts observations into groups, baseline values for each statistic can be computed as follows:
   %Response = 100*P
   Cumulative %Response = 100*P
   %Captured = 100*ni/N
   Cumulative %Captured = 100*Σini/N
   Lift = 1
   Cumulative Lift = 1
   Gain = 0
- LIMITATIONS:
- Only unaggregated data can be used. That is, the GainLift macro cannot be used on data which were fitted using events/trials syntax in the MODEL statement of the fitting procedure, or if a FREQ statement was used. To use the macro for such data, the data must be expanded so that each observation represents a single individual or item. This can be done using a DATA step and DO loops containing OUTPUT statements.
If the data were collected by sampling from the response levels, such as to oversample the event or in case-control settings, then see this note on adjusting the predicted probabilities for the sampling before using the macro.
- MISSING VALUES:
- Observations that resulted in missing predicted probability (such as when a predictor value is missing) are ignored and do not influence the statistics.
These sample files and code examples are provided by SAS Institute Inc. "as is" without warranty of any kind, either express or implied, including but not limited to the implied warranties of merchantability and fitness for a particular purpose. Recipients acknowledge and agree that SAS Institute shall not be liable for any damages whatsoever arising out of their use of this material. In addition, SAS Institute will provide no support for the materials contained herein.
These sample files and code examples are provided by SAS Institute Inc. "as is" without warranty of any kind, either express or implied, including but not limited to the implied warranties of merchantability and fitness for a particular purpose. Recipients acknowledge and agree that SAS Institute shall not be liable for any damages whatsoever arising out of their use of this material. In addition, SAS Institute will provide no support for the materials contained herein.
- EXAMPLE: Modeling cancer remission data
-
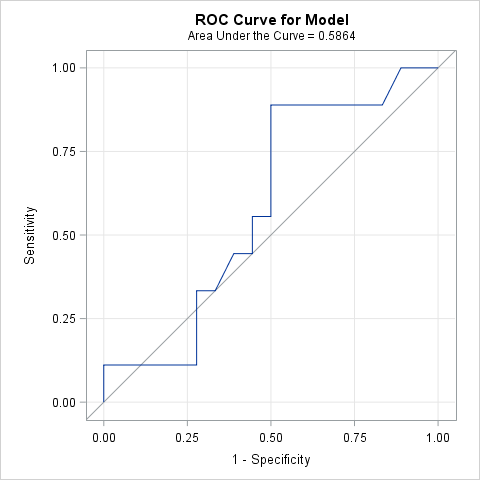
The following example uses the cancer remission data presented in the stepwise logistic regression example in the LOGISTIC documentation. The first model uses only a single predictor. These statements fit the model, produce the ROC plot, and create a data set (OUT) for later use in the GainLift macro.
      ods graphics on;
      title "Cancer remission model (smear)";
      proc logistic data=remission plots(only)=roc;
         model remiss(event='1') = smear;
         output out=out p=p;
         run;
The performance of the model is assessed by the ROC curve provided by PROC LOGISTIC and by the plots from the GainLift macro. The area under the ROC curve is 0.586 indicating only a slight improvement in predictive ability of this model over an uninformative model containing only an intercept (with area 0.5).
Cancer remission model (smear)
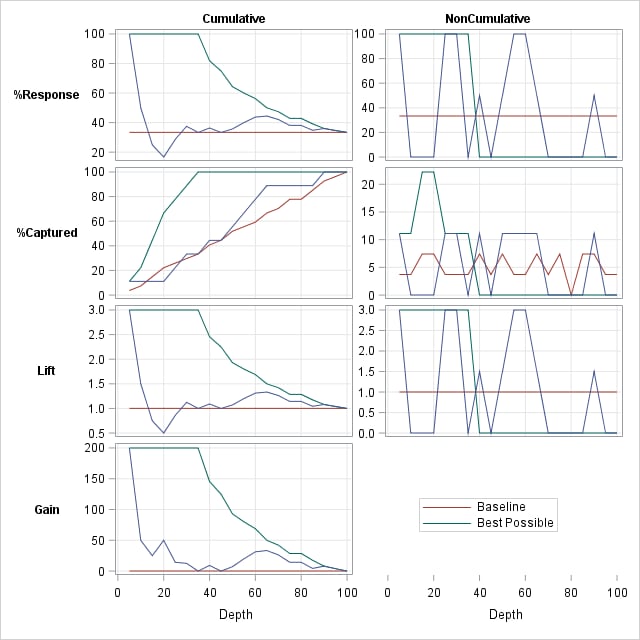
The GainLift macro is called next to provide additional assessment of the model. The default table of statistics is suppressed by the TABLEOPTS=NOTABLE option.
      %inc "<location of your file containing the GainLift macro>";
      %GainLift(data=out, response=remiss, p=p, event=1, tableopts=notable)
The cumulative plots from the GainLift macro show curves for the model that do not deviate much from baseline and are far from the best possible which again indicates a poorly performing model.
Cancer remission model (smear)
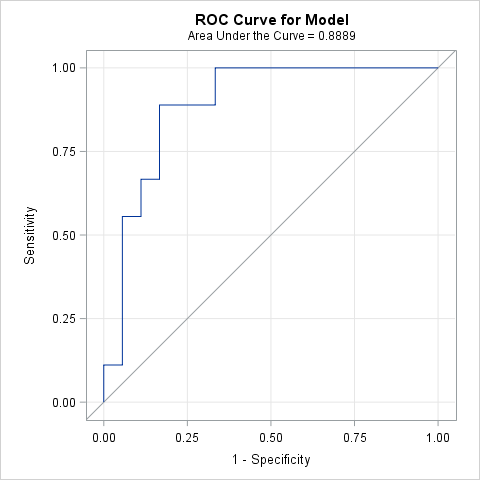
The final model found by stepwise selection is assessed next. These statements fit the model and produce the ROC plot.
      title "Cancer remission model (li temp cell)";
      proc logistic data=remission plots(only)=roc;
         model remiss(event='1') = li temp cell;
         output out=out p=p;
         run;
The area under the ROC curve for this model is 0.889 indicating much better performance.
Cancer remission model (li temp cell)
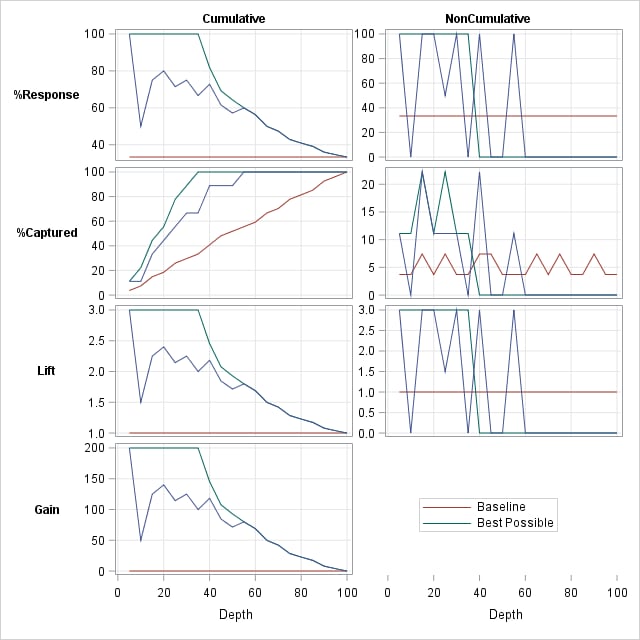
The GainLift macro is called to evaluate this new model.
%GainLift(data=out, response=remiss, p=p, event=1)The plots from the GainLift macro are now much closer to the best possible case than to the baseline case. In the table and plot, the cumulative percent of remissions captured is over 55% using only the top 25% of predicted remission probabilities. The cumulative percent response indicates that the top 20% of predicted remission probabilities contain 80% remissions. This is a factor of 2.4 (cumulative lift) times the base (overall) remission rate of 33%, or a 140% gain.
Cancer remission model (li temp cell)
Depth Percentile
RangeGroup Size Number
of EventsCumulative
Number
of EventsPercent
ResponseCumulative Percent
ResponsePercent Captured Cumulative Percent
CapturedLift Cumulative Lift Gain 5 100-95 1 1 1 100 100.000 11.1111 11.111 3.0 3.00000 200.000 10 95-90 1 0 1 0 50.000 0.0000 11.111 0.0 1.50000 50.000 15 90-85 2 2 3 100 75.000 22.2222 33.333 3.0 2.25000 125.000 20 85-80 1 1 4 100 80.000 11.1111 44.444 3.0 2.40000 140.000 25 80-75 2 1 5 50 71.429 11.1111 55.556 1.5 2.14286 114.286 30 75-70 1 1 6 100 75.000 11.1111 66.667 3.0 2.25000 125.000 35 70-65 1 0 6 0 66.667 0.0000 66.667 0.0 2.00000 100.000 40 65-60 2 2 8 100 72.727 22.2222 88.889 3.0 2.18182 118.182 45 60-55 2 0 8 0 61.538 0.0000 88.889 0.0 1.84615 84.615 50 55-50 1 0 8 0 57.143 0.0000 88.889 0.0 1.71429 71.429 55 50-45 1 1 9 100 60.000 11.1111 100.000 3.0 1.80000 80.000 60 45-40 1 0 9 0 56.250 0.0000 100.000 0.0 1.68750 68.750 65 40-35 2 0 9 0 50.000 0.0000 100.000 0.0 1.50000 50.000 70 35-30 1 0 9 0 47.368 0.0000 100.000 0.0 1.42105 42.105 75 30-25 2 0 9 0 42.857 0.0000 100.000 0.0 1.28571 28.571 80 25-20 1 0 9 0 40.909 0.0000 100.000 0.0 1.22727 22.727 85 20-15 1 0 9 0 39.130 0.0000 100.000 0.0 1.17391 17.391 90 15-10 2 0 9 0 36.000 0.0000 100.000 0.0 1.08000 8.000 95 10-5 1 0 9 0 34.615 0.0000 100.000 0.0 1.03846 3.846 100 5-0 1 0 9 0 33.333 0.0000 100.000 0.0 1.00000 0.000 27 9
Cancer remission model (li temp cell)
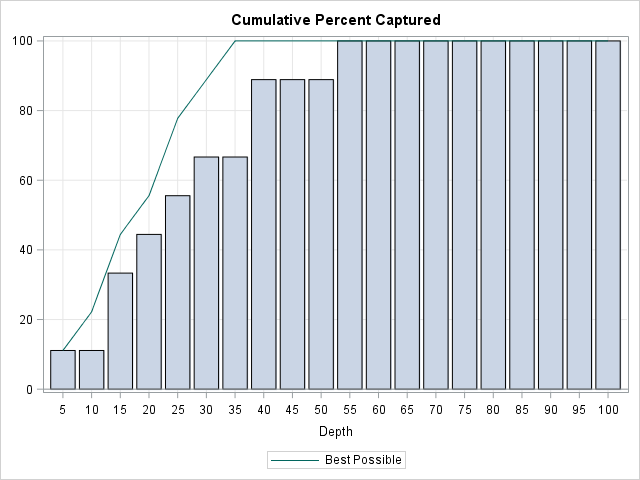
The following macro call produces a bar chart version of the cumulative percent captured plot for the final model. The baseline case is omitted by the NOBASE option.
      %GainLift(data=out, response=remiss, p=p, event=1, plots=ccapt,
                graphopts=bar nobase, tableopts=notable)
Cancer remission model (li temp cell)
Right-click on the link below and select Save to save the GainLift macro definition to a file. It is recommended that you name the file GainLift.sas.
| Type: | Sample |
| Topic: | Analytics ==> Categorical Data Analysis Analytics ==> Regression |
| Date Modified: | 2017-02-23 14:36:10 |
| Date Created: | 2010-11-24 14:49:04 |
Operating System and Release Information
| Product Family | Product | Host | SAS Release | |
| Starting | Ending | |||
| SAS System | SAS/STAT | z/OS | ||
| OpenVMS VAX | ||||
| Microsoft® Windows® for 64-Bit Itanium-based Systems | ||||
| Microsoft Windows Server 2003 Datacenter 64-bit Edition | ||||
| Microsoft Windows Server 2003 Enterprise 64-bit Edition | ||||
| Microsoft Windows XP 64-bit Edition | ||||
| Microsoft® Windows® for x64 | ||||
| OS/2 | ||||
| Microsoft Windows 95/98 | ||||
| Microsoft Windows 2000 Advanced Server | ||||
| Microsoft Windows 2000 Datacenter Server | ||||
| Microsoft Windows 2000 Server | ||||
| Microsoft Windows 2000 Professional | ||||
| Microsoft Windows NT Workstation | ||||
| Microsoft Windows Server 2003 Datacenter Edition | ||||
| Microsoft Windows Server 2003 Enterprise Edition | ||||
| Microsoft Windows Server 2003 Standard Edition | ||||
| Microsoft Windows Server 2003 for x64 | ||||
| Microsoft Windows Server 2008 | ||||
| Microsoft Windows Server 2008 for x64 | ||||
| Microsoft Windows XP Professional | ||||
| Windows 7 Enterprise 32 bit | ||||
| Windows 7 Enterprise x64 | ||||
| Windows 7 Home Premium 32 bit | ||||
| Windows 7 Home Premium x64 | ||||
| Windows 7 Professional 32 bit | ||||
| Windows 7 Professional x64 | ||||
| Windows 7 Ultimate 32 bit | ||||
| Windows 7 Ultimate x64 | ||||
| Windows Millennium Edition (Me) | ||||
| Windows Vista | ||||
| Windows Vista for x64 | ||||
| 64-bit Enabled AIX | ||||
| 64-bit Enabled HP-UX | ||||
| 64-bit Enabled Solaris | ||||
| ABI+ for Intel Architecture | ||||
| AIX | ||||
| HP-UX | ||||
| HP-UX IPF | ||||
| IRIX | ||||
| Linux | ||||
| Linux for x64 | ||||
| Linux on Itanium | ||||
| OpenVMS Alpha | ||||
| OpenVMS on HP Integrity | ||||
| Solaris | ||||
| Solaris for x64 | ||||
| Tru64 UNIX | ||||