Sample 40977: Using Microsoft Excel data as input to a task in the SAS® Add-In for Microsoft Office
 |  |  |
Overview
SAS Add-In for Microsoft Office 4.3 gives you the option to use Microsoft Excel data as the input to a SAS task. In this sample, you will learn how to use Excel data to create a bar chart with SAS.Selecting input data
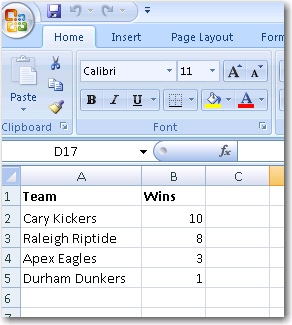
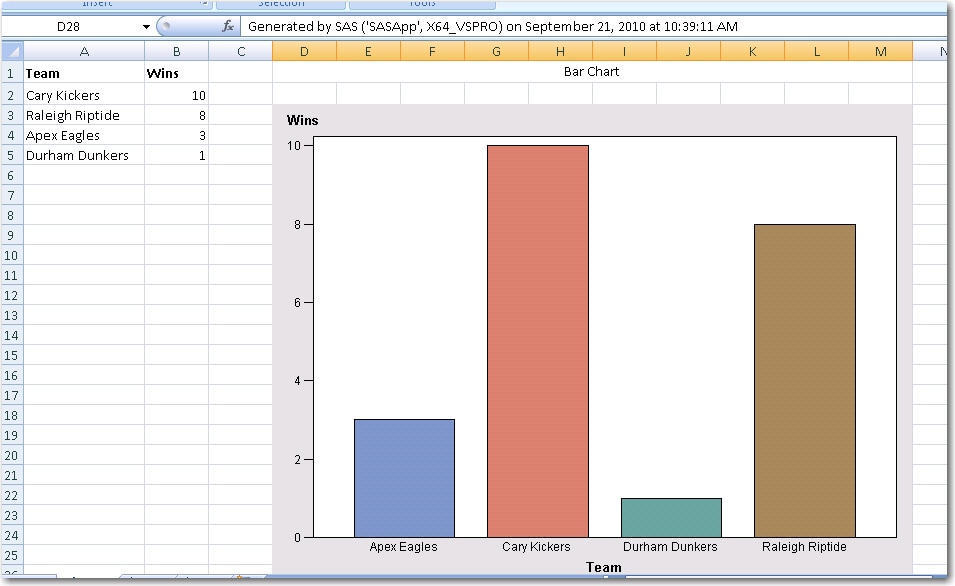
For this sample, the Excel spreadsheet includes a list of teams and their number of wins.
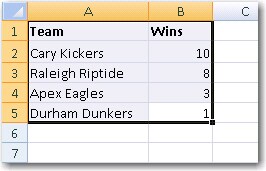
To use the data as input to the task, you select the cells as shown in the following display.
Creating the bar chart
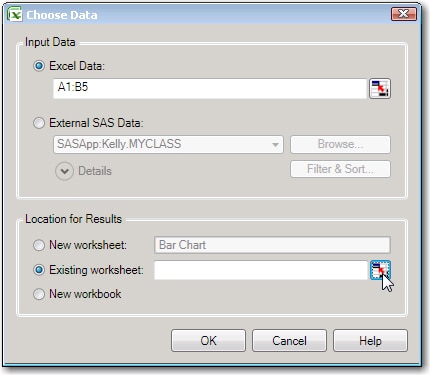
Under the SAS tab, select Tasks ► Graph ► Bar Chart. In the Choose Data dialog box, you are prompted for the location of the Input Data. Because the Excel data is highlighted in our worksheet, this field already contains the cell address for the data. For the Location for Results, select Existing worksheet, and then click the icon with the red arrow, as shown.
Clicking the icon opens the Choose Location dialog box. Select a cell in the worksheet and the location will fill in automatically as the location for your results.
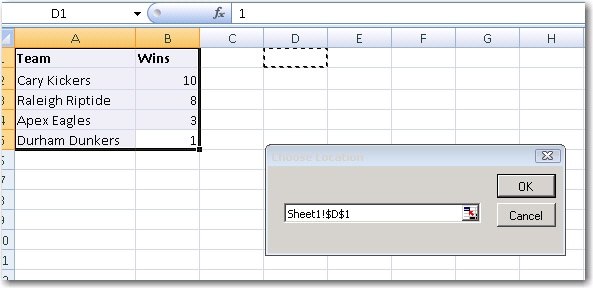
Click OK in the Choose Location dialog box, then click OK in the Choose Data dialog box. Now, the Bar Chart Task appears. Select Vertical Colored Bar as the type of bar chart, and chart the team to show the number of wins. Click Run to create the following chart at the location that you selected.
Additional Documentation
For more information about the SAS Add-In for Microsoft Office, see the SAS Add-In for Microsoft Office documentation page.
These sample files and code examples are provided by SAS Institute Inc. "as is" without warranty of any kind, either express or implied, including but not limited to the implied warranties of merchantability and fitness for a particular purpose. Recipients acknowledge and agree that SAS Institute shall not be liable for any damages whatsoever arising out of their use of this material. In addition, SAS Institute will provide no support for the materials contained herein.
These sample files and code examples are provided by SAS Institute Inc. "as is" without warranty of any kind, either express or implied, including but not limited to the implied warranties of merchantability and fitness for a particular purpose. Recipients acknowledge and agree that SAS Institute shall not be liable for any damages whatsoever arising out of their use of this material. In addition, SAS Institute will provide no support for the materials contained herein.
| Type: | Sample |
| Date Modified: | 2010-09-28 10:32:12 |
| Date Created: | 2010-09-21 12:03:03 |
Operating System and Release Information
| Product Family | Product | Host | Product Release | SAS Release | ||
| Starting | Ending | Starting | Ending | |||
| SAS System | SAS Add-in for Microsoft Office | Microsoft® Windows® for x64 | 4.3 | 9.2 TS2M2 | ||
| Microsoft Windows Server 2003 Datacenter Edition | 4.3 | 9.2 TS2M2 | ||||
| Microsoft Windows Server 2003 Enterprise Edition | 4.3 | 9.2 TS2M2 | ||||
| Microsoft Windows Server 2003 Standard Edition | 4.3 | 9.2 TS2M2 | ||||
| Microsoft Windows Server 2003 for x64 | 4.3 | 9.2 TS2M2 | ||||
| Microsoft Windows Server 2008 | 4.3 | 9.2 TS2M2 | ||||
| Microsoft Windows Server 2008 for x64 | 4.3 | 9.2 TS2M2 | ||||
| Microsoft Windows XP Professional | 4.3 | 9.2 TS2M2 | ||||
| Windows 7 Enterprise 32 bit | 4.3 | 9.2 TS2M2 | ||||
| Windows 7 Enterprise x64 | 4.3 | 9.2 TS2M2 | ||||
| Windows 7 Home Premium 32 bit | 4.3 | 9.2 TS2M2 | ||||
| Windows 7 Home Premium x64 | 4.3 | 9.2 TS2M2 | ||||
| Windows 7 Professional 32 bit | 4.3 | 9.2 TS2M2 | ||||
| Windows 7 Professional x64 | 4.3 | 9.2 TS2M2 | ||||
| Windows 7 Ultimate 32 bit | 4.3 | 9.2 TS2M2 | ||||
| Windows 7 Ultimate x64 | 4.3 | 9.2 TS2M2 | ||||
| Windows Vista | 4.3 | 9.2 TS2M2 | ||||
| Windows Vista for x64 | 4.3 | 9.2 TS2M2 | ||||