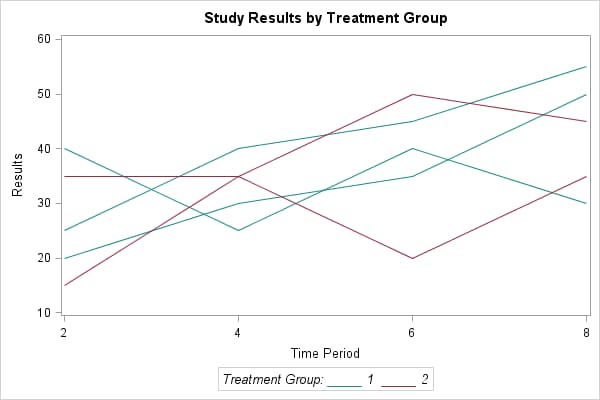
Sample 40255: Plot of study results by treatment group
 |  |  |  |  |
This sample generates a plot of study results by treatment group. This type of graph is also known as a "spaghetti plot". The program dynamically generates style elements to specify the color for each subject's plot line based on the value of the treatment group.
These sample files and code examples are provided by SAS Institute Inc. "as is" without warranty of any kind, either express or implied, including but not limited to the implied warranties of merchantability and fitness for a particular purpose. Recipients acknowledge and agree that SAS Institute shall not be liable for any damages whatsoever arising out of their use of this material. In addition, SAS Institute will provide no support for the materials contained herein.
This sample dynamically generates style elements to specify the color for each subject's plot line based on the value of the treatment group.
/* Create sample data to plot. */
data one;
   input trt_group time subject results;
   datalines;
1   2   100  20
1   4   100  30
1   6   100  35
1   8   100  50
1   2   200  40
1   4   200  25
1   6   200  40
1   8   200  30
1   2   300  25
1   4   300  40
1   6   300  45
1   8   300  55
2   2   400  15
2   4   400  35
2   6   400  50
2   8   400  45
2   2   500  35
2   4   500  35
2   6   500  20
2   8   500  35
;
run;

proc sort data=one;
   by subject;
run;

/* Count the number of unique values of SUBJECT. */
/* Also create macro variables containing the    */
/* style values for each plot line.  The line    */
/* color is based on the treatment group.        */
data _null_;
   set one end=eof;
   by subject;
   if first.subject then do;
      if trt_group=1 then color='vibg';
      else color='depk';
      count+1;
      call symput('gd'||trim(left(count)),
                  'style '|| 'GraphData' || trim(left(count)) ||
                  ' from GraphData' || trim(left(count)) ||
                  ' / ContrastColor=' || trim(left(color)) ||
                  ' linestyle=1;');
   end;
   if eof then call symput('total',count);
run;

/* Define a macro that generates all style changes. */
%macro gdata;
   %do i=1 %to &total;
      &&gd&i
   %end;
%mend gdata;

/* Create the custom style. */
proc template;
   define style styles.mystyle;
   parent=styles.default;
      %gdata;
   end;
run;

ods listing close;
ods html file='SpagPlot.html' path='.' style=styles.mystyle;

/* Create the graph. */
proc sgplot data=one noautolegend;
   series x=time y=results / group=subject;
   xaxis label="Time Period" values=(2 to 8 by 2);
   yaxis label="Results" values=(10 to 60 by 10);
   title "Study Results by Treatment Group";

/* Use a FOOTNOTE statement to simulate a legend. */
   footnote1 box=1 bcolor=white
             'Treatment Group: '
             color=vibg  "_____"
             color=black " 1  "
             color=depk   "_____"
             color=black " 2";

run;

ods html close;
ods listing;
These sample files and code examples are provided by SAS Institute Inc. "as is" without warranty of any kind, either express or implied, including but not limited to the implied warranties of merchantability and fitness for a particular purpose. Recipients acknowledge and agree that SAS Institute shall not be liable for any damages whatsoever arising out of their use of this material. In addition, SAS Institute will provide no support for the materials contained herein.
This sample dynamically generates style elements to specify the color for each subject's plot line based on the value of the treatment group.
| Type: | Sample |
| Topic: | SAS Reference ==> Procedures ==> SGPLOT |
| Date Modified: | 2010-07-07 13:16:49 |
| Date Created: | 2010-07-07 12:56:10 |
Operating System and Release Information
| Product Family | Product | Host | SAS Release | |
| Starting | Ending | |||
| SAS System | SAS/GRAPH | z/OS | 9.2 TS1M0 | |
| Microsoft® Windows® for 64-Bit Itanium-based Systems | 9.2 TS1M0 | |||
| Microsoft Windows Server 2003 Datacenter 64-bit Edition | 9.2 TS1M0 | |||
| Microsoft Windows Server 2003 Enterprise 64-bit Edition | 9.2 TS1M0 | |||
| Microsoft Windows XP 64-bit Edition | 9.2 TS1M0 | |||
| Microsoft® Windows® for x64 | 9.2 TS1M0 | |||
| Microsoft Windows Server 2003 Datacenter Edition | 9.2 TS1M0 | |||
| Microsoft Windows Server 2003 Enterprise Edition | 9.2 TS1M0 | |||
| Microsoft Windows Server 2003 Standard Edition | 9.2 TS1M0 | |||
| Microsoft Windows XP Professional | 9.2 TS1M0 | |||
| Windows Vista | 9.2 TS1M0 | |||
| Windows Vista for x64 | 9.2 TS1M0 | |||
| 64-bit Enabled AIX | 9.2 TS1M0 | |||
| 64-bit Enabled HP-UX | 9.2 TS1M0 | |||
| 64-bit Enabled Solaris | 9.2 TS1M0 | |||
| HP-UX IPF | 9.2 TS1M0 | |||
| Linux | 9.2 TS1M0 | |||
| Linux for x64 | 9.2 TS1M0 | |||
| OpenVMS on HP Integrity | 9.2 TS1M0 | |||
| Solaris for x64 | 9.2 TS1M0 | |||
