Sample 37028: Assigning group breaks to stored process prompts in SAS® Web Report Studio
 |  |  |  |
Overview
In SAS Web Report Studio, you can include output from a stored process and results from an information map in the same report section. In version 4.2, you can have the output from both data sources share the same grouping criteria. You perform this task by assigning the group breaks in the report to the prompts in the stored process.
About the sample report
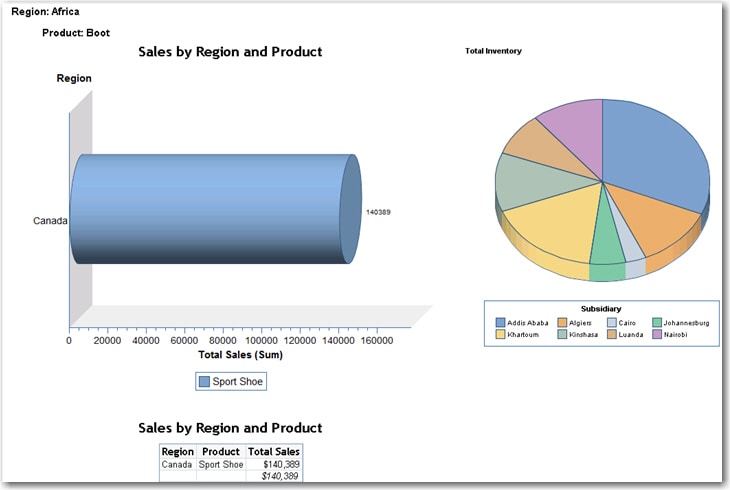
In the following report, the output from a prompted stored process is displayed on the left and the query results from an information map are displayed in the pie chart on the right. The stored process output is filtered by its prompt values ("Canada" for region and "Sport Shoe" for product). By contrast, the pie chart shows results for the currently selected group breaks ("Africa" for region and "Boot" for product).
This sample shows you how to assign the region and product prompts in the stored process to the region and product group breaks in the report. After you make this association, the stored process and the pie chart will display results that are based on the same criteria.
About the sample data
As the input table for the information map and the stored process, this sample uses SASHELP.SHOES.
To create the Shoe Sales information map, you can submit the PROC INFOMAPS code on the Full Code tab in this sample.
The code for the Shoe Sales stored process is below.
OPTIONS VALIDVARNAME=ANY;
%global REGION;
%global PRODUCT;
*ProcessBody;
%stpbegin;
title "Sales by Region and Product";
legend1 label=none frame;
proc gchart data=sashelp.shoes
(where=(upcase(region)=upcase(strip("®ion"))
and upcase(product)=upcase(strip("&product")))) ;
hbar3d region / sumvar=sales
sum space=.6
subgroup=product
shape=cylinder
patternid=subgroup
legend=legend1;
label product='Shoe Style';
run;
proc report data=sashelp.shoes
(where=(upcase(region)=upcase(strip("®ion"))
and upcase(product)=upcase(strip("&product")))) ;
column region product sales;
define region / group;
define product / group;
define sales / analysis sum;
break after region / ol summarize suppress skip;
run;
%stpend;
|
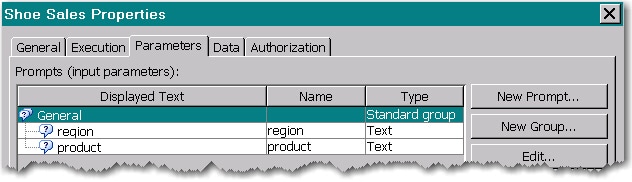
After copying the code to your own environment, use SAS® Management Console to register the stored process. Navigate to a folder such as /Shared Data/StoredProcesses, right-click on the folder and select New Stored Process. During the registration, specify SASApp - Logical Workspace Server as the SAS server to use. The output type should be set to Package. Also, remember to define the prompts for region and product, as shown below.
For more help with registration, click the Help button in the New Stored Process Wizard.
Design the report
- Log into SAS Web Report Studio, click Open, and select the Shoe Sales stored process.
- Enter values for region and product, and then click View Report.
- After the output appears, click the Edit tab.
- Click the
 toolbar icon to insert an empty cell next to the stored process.
 - From the Data menu, select Select Data .
- Open the Shoe Sales information map and select all available data items. Click OK when you are done.
- Insert a pie chart into the empty cell.
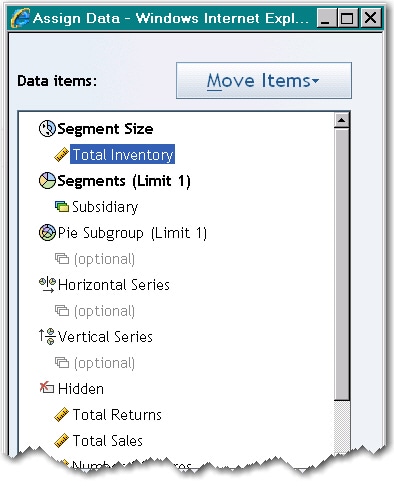
- Right-click on the chart and select Assign Data. Assign Total Inventory to the Segment Size and Subsidiary to Segments, and hide all of the other data items.
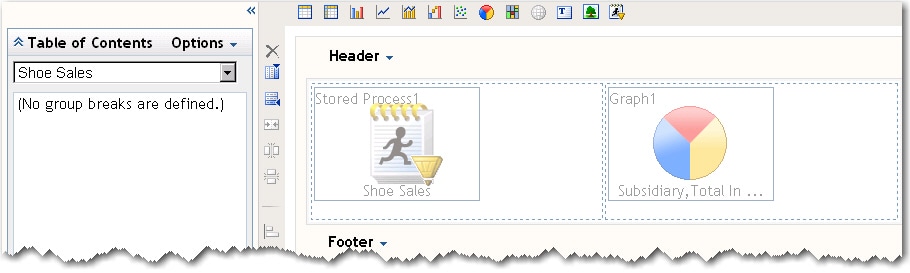
Here is what the report might look like at this point.
Add the group breaks
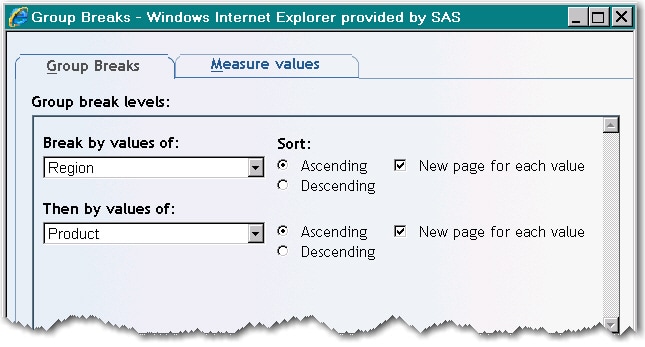
- From the Data menu, select Edit Group Breaks.
- In the Group Breaks dialog box, select to break by Region and Product. Choose to display a new page for each value.
- Click OK.
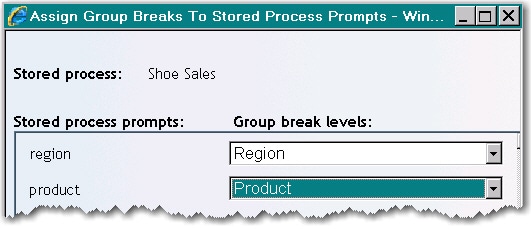
Associate the group breaks with the stored process prompts
- Right-click on the stored process and select Assign Group Breaks.
- Associate the region prompt with the Region group break and the product prompt with the Product group break.
- Click OK.
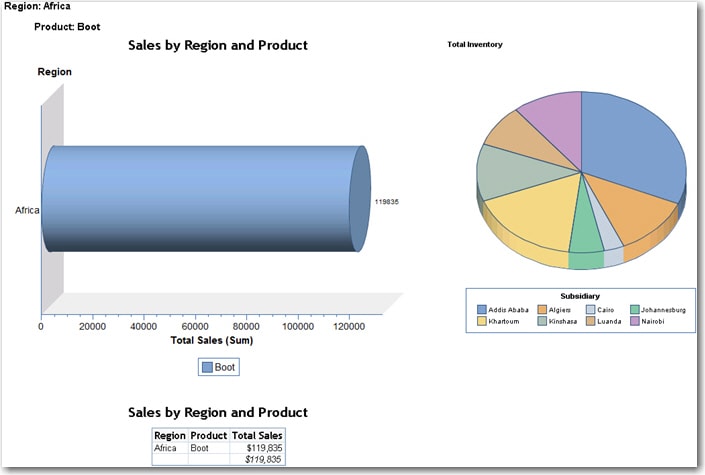
View the report
Click View to render the report. Because the group breaks provide the values for the prompts, the prompt window is bypassed. In the following report, notice that all of the results are now based on the same criteria: "Africa" for region and "Boot" for product.
.
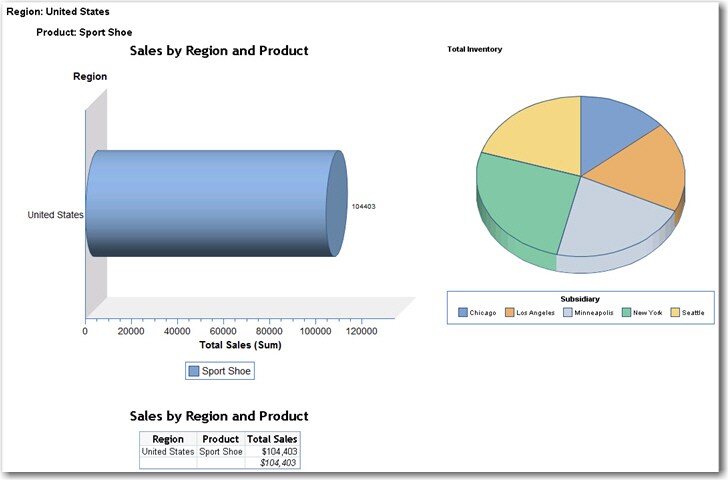
Here is how the output changes if you select "United States" as the region group break and "Sport Shoe" as the product group break.
Tip: You can assign group breaks to stored process prompts simply by adding compatible data items from an information map to the report. You do not have to use the data items in a table or graph. For example, if you remove the pie chart from the sample report, the group breaks can still supply the prompt values for region and product.
Additional Documentation
For more information about SAS Web Report Studio, see the SAS Web Report Studio documentation page.
For more information about SAS Management Console, see the SAS Management Console documentation page.
For more information about PROC INFOMAPS, see the Base SAS 9.2 Guide to Information Maps.
These sample files and code examples are provided by SAS Institute Inc. "as is" without warranty of any kind, either express or implied, including but not limited to the implied warranties of merchantability and fitness for a particular purpose. Recipients acknowledge and agree that SAS Institute shall not be liable for any damages whatsoever arising out of their use of this material. In addition, SAS Institute will provide no support for the materials contained herein.
Before submitting this code, these tasks must be done:
- The SHOES table and its library (in this sample, SASHELP) must be registered in metadata.
- The location of the information map (specified by mpath) and the PROC INFOMAPS statement must be modified to use the correct values for your environment.
Note: For information about registering libraries and tables, see the SAS 9.2 Intelligence Platform: Data Administration Guide.
%let mpath=/Shared Data/your-map-folder;

proc infomaps metauser="your-userID"
	metapass="your-password"
	metaserver="your-metadata-server.com"
	metaport=8561
	metarepository=Foundation
	mappath="&mpath";

* delete infomap "Shoe Sales";
open infomap "Shoe Sales";
insert datasource sasserver="SASApp"
	table="SASHELP"."Shoes" _all_;
save;
* list _all_;
run;
These sample files and code examples are provided by SAS Institute Inc. "as is" without warranty of any kind, either express or implied, including but not limited to the implied warranties of merchantability and fitness for a particular purpose. Recipients acknowledge and agree that SAS Institute shall not be liable for any damages whatsoever arising out of their use of this material. In addition, SAS Institute will provide no support for the materials contained herein.
| Type: | Sample |
| Topic: | Query and Reporting ==> Interactive Querying Query and Reporting |
| Date Modified: | 2009-09-03 10:54:13 |
| Date Created: | 2009-08-28 12:27:23 |
Operating System and Release Information
| Product Family | Product | Host | Product Release | SAS Release | ||
| Starting | Ending | Starting | Ending | |||
| SAS System | SAS Web Report Studio | z/OS | 4.2 | 9.2 TS2M0 | ||
| Microsoft® Windows® for x64 | 4.2 | 9.2 TS2M0 | ||||
| Microsoft Windows Server 2003 Datacenter Edition | 4.2 | 9.2 TS2M0 | ||||
| Microsoft Windows Server 2003 Enterprise Edition | 4.2 | 9.2 TS2M0 | ||||
| Microsoft Windows Server 2003 Standard Edition | 4.2 | 9.2 TS2M0 | ||||
| Microsoft Windows Server 2008 | 4.2 | 9.2 TS2M0 | ||||
| Microsoft Windows XP Professional | 4.2 | 9.2 TS2M0 | ||||
| Windows Vista | 4.2 | 9.2 TS2M0 | ||||
| 64-bit Enabled AIX | 4.2 | 9.2 TS2M0 | ||||
| 64-bit Enabled Solaris | 4.2 | 9.2 TS2M0 | ||||
| HP-UX IPF | 4.2 | 9.2 TS2M0 | ||||
| Linux for x64 | 4.2 | 9.2 TS2M0 | ||||
| Solaris for x64 | 4.2 | 9.2 TS2M0 | ||||