Usage Note 37000: Producing a scatter plot matrix of ranked variables if SPEARMAN correlations are requested
 |  |  |
When Spearman correlations are requested in PROC CORR by specifying the SPEARMAN option, the correlations are computed by ranking the data and using the ranks in the Pearson product-moment correlation formula. However, the PLOTS= option in the PROC CORR statement only produces scatter plots of the original, not the ranked, variables. Scatter plots of the ranked variables are not available in PROC CORR. However, beginning in SAS 9.2 you can use PROC SGSCATTER to produce scatter plots after ranking the data with PROC RANK.
For more information on PROC SGSCATTER, see the PROC SGSCATTER documentation.
The example below illustrates how Spearman correlations and a corresponding scatter plot matrix of ranked variables can be produced for the following fitness data.
   data Fitness;
         input Age Weight Oxygen RunTime @@;
         datalines;
      44 89.47 44.609 11.37    40 75.07 45.313 10.07
      44 85.84 54.297  8.65    42 68.15 59.571  8.17
      38 89.02 49.874   .      47 77.45 44.811 11.63
      40 75.98 45.681 11.95    43 81.19 49.091 10.85
      44 81.42 39.442 13.08    38 81.87 60.055  8.63
      44 73.03 50.541 10.13    45 87.66 37.388 14.03
      45 66.45 44.754 11.12    47 79.15 47.273 10.60
      54 83.12 51.855 10.33    49 81.42 49.156  8.95
      51 69.63 40.836 10.95    51 77.91 46.672 10.00
      48 91.63 46.774 10.25    49 73.37   .    10.08
      57 73.37 39.407 12.63    54 79.38 46.080 11.17
      52 76.32 45.441  9.63    50 70.87 54.625  8.92
      51 67.25 45.118 11.08    54 91.63 39.203 12.88
      51 73.71 45.790 10.47    57 59.08 50.545  9.93
      49 76.32   .      .      48 61.24 47.920 11.50
      52 82.78 47.467 10.50
      ;
The SPEARMAN option in PROC CORR produces the Spearman correlations.
   proc corr data=Fitness spearman;
   run;
| ||||||||||||||||||||||||||||||||||||||||||||||||||||||||||||||||||||||||||||||
To produce the scatter plot of ranked variables, first rank the data and create an output data set named RANKDATA containing the ranked variables.
   proc rank data=fitness out=rankdata;
   run;
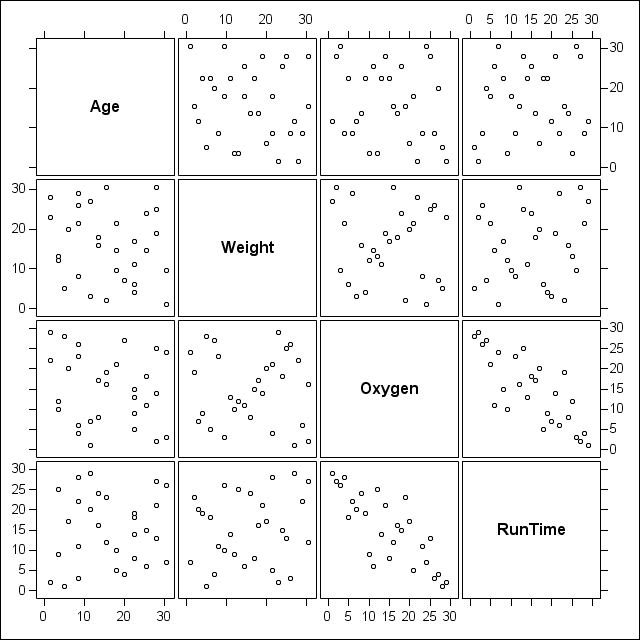
Finally, use PROC SGSCATTER to produce the scatter plot matrix of ranked variables corresponding to the Spearman correlations above. The NOLABEL option is temporarily set so that variable names are displayed along the diagonal of the scatter plot matrix rather than the labels of the ranked variables assigned by PROC RANK.
   options nolabel;
   ods html;

   proc sgscatter data=rankdata;
     matrix age weight oxygen runtime;
   run;

   options label;
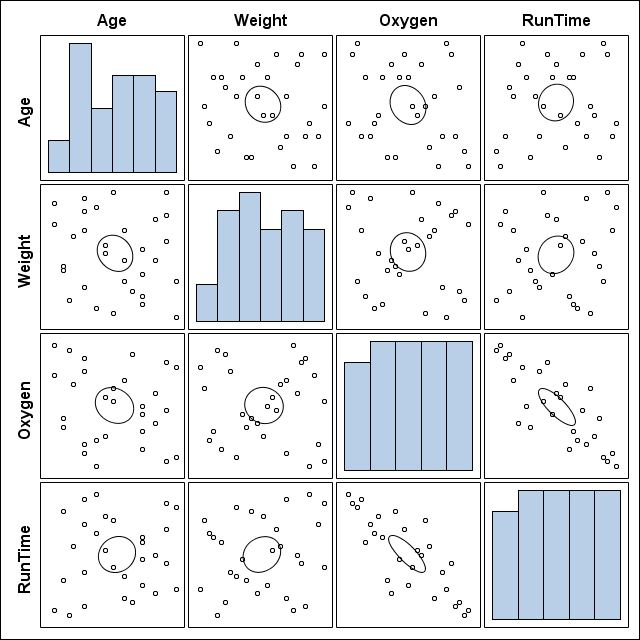
The scatter plot can be enhanced using options in the MATRIX statement. For example, confidence ellipses for the mean can be added with the ELLIPSE=(TYPE=MEAN) option and a histogram of each variable replaces the variable name when the DIAGONAL=(HISTOGRAM) option is specified. Notice that the strong correlation (-0.8) between Runtime and Oxygen is apparent from the linear trend in the plot and the narrow ellipse.
   proc sgscatter data=rankdata;
     matrix age weight oxygen runtime / ellipse=(type=mean) diagonal=(histogram);
   run;

   ods html close;
Operating System and Release Information
| Product Family | Product | System | SAS Release | |
| Reported | Fixed* | |||
| SAS System | Base SAS | z/OS | 9.2 TS1M0 | |
| Microsoft® Windows® for 64-Bit Itanium-based Systems | 9.2 TS1M0 | |||
| Microsoft Windows Server 2003 Datacenter 64-bit Edition | 9.2 TS1M0 | |||
| Microsoft Windows Server 2003 Enterprise 64-bit Edition | 9.2 TS1M0 | |||
| Microsoft Windows XP 64-bit Edition | 9.2 TS1M0 | |||
| Microsoft® Windows® for x64 | 9.2 TS1M0 | |||
| Microsoft Windows Server 2003 Datacenter Edition | 9.2 TS1M0 | |||
| Microsoft Windows Server 2003 Enterprise Edition | 9.2 TS1M0 | |||
| Microsoft Windows Server 2003 Standard Edition | 9.2 TS1M0 | |||
| Microsoft Windows Server 2008 | 9.2 TS1M0 | |||
| Microsoft Windows XP Professional | 9.2 TS1M0 | |||
| Windows Vista | 9.2 TS1M0 | |||
| 64-bit Enabled AIX | 9.2 TS1M0 | |||
| 64-bit Enabled HP-UX | 9.2 TS1M0 | |||
| 64-bit Enabled Solaris | 9.2 TS1M0 | |||
| HP-UX IPF | 9.2 TS1M0 | |||
| Linux | 9.2 TS1M0 | |||
| Linux for x64 | 9.2 TS1M0 | |||
| OpenVMS on HP Integrity | 9.2 TS1M0 | |||
| Solaris for x64 | 9.2 TS1M0 | |||
| Type: | Usage Note |
| Priority: | |
| Topic: | SAS Reference ==> Procedures ==> CORR Analytics ==> Descriptive Statistics Analytics ==> Statistical Graphics |
| Date Modified: | 2009-08-28 10:52:02 |
| Date Created: | 2009-08-26 15:54:04 |