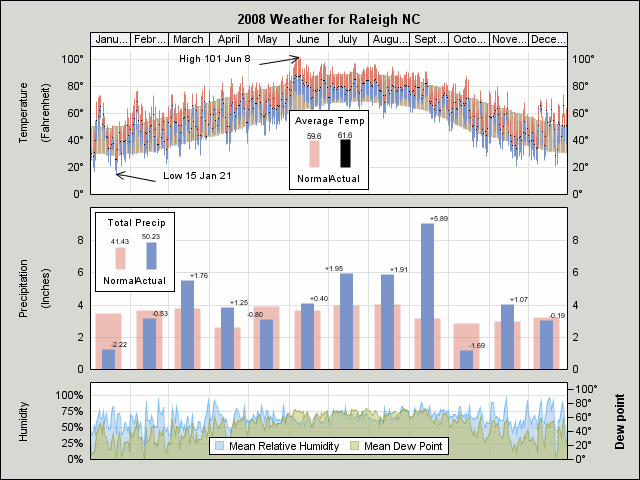
Sample 35177: Three-Row Lattice Layout
 |  |  |  |  |  |
This samples uses the Graph Template Language (GTL) to produce a three-row lattice layout.
These sample files and code examples are provided by SAS Institute Inc. "as is" without warranty of any kind, either express or implied, including but not limited to the implied warranties of merchantability and fitness for a particular purpose. Recipients acknowledge and agree that SAS Institute shall not be liable for any damages whatsoever arising out of their use of this material. In addition, SAS Institute will provide no support for the materials contained herein.
Before running the code below, click on the Download tab and download the data set fusion_35177_2_weather. Change the LIBNAME statement at the end of this program to point to the location where the data set has been stored.
proc template;
  define statgraph weather;
  begingraph / designwidth=640px designheight=480px backgroundcolor=cxd5d9d2;
  entrytitle "2008 Weather for Raleigh NC";
  layout lattice / columndatarange=unionall columns=1
                   rowgutter=5px rowweights=(.40 .40 .20);
    columnaxes;
      columnaxis / display=none type=linear offsetmin=0 offsetmax=0
                 linearopts=( thresholdmin=0 thresholdmax=0 viewmax="31dec2008"d);
    endcolumnaxes;
    rowheaders;
      layout gridded / columns=2;
        entry "Temperature" / /* textattrs=(weight=bold)*/ rotate=90;
        entry "(Fahrenheit)" / rotate=90;
      endlayout;
      layout gridded / columns=2;
        entry "Precipitation" / /*textattrs=(weight=bold)*/ rotate=90;
        entry "(Inches)" / rotate=90;
      endlayout;
        entry "Humidity" / /*textattrs=(weight=bold)*/ rotate=90;
    endrowheaders;
   /* row 1 - temperatures */
   layout overlay / yaxisopts=(display=(tickvalues) displaysecondary=(tickvalues)
                    label="Fahreheit" offsetmin=0 griddisplay=on
                    linearopts=(viewmin=0 viewmax=100));
     innermargin / align=top;
       /* display month names */
       blockplot x=start  block=Month / display=(fill outline values)
                        valuehalign=center valuevalign=center
                        filltype=alternate fillattrs=GraphAltBlock altfillattrs=GraphAltBlock;
     endinnermargin;
   /* inset for annual temps */
   layout overlay / width=80px height=80px halign=center valign=bottom border=true
                    walldisplay=(fill) opaque=true
                    xaxisopts=(display=(tickvalues) tickvalueattrs=GraphDataText
                    linearopts=(viewmin=.5 viewmax=2.5
                    tickvaluelist=(1 2)) offsetmin=.1 offsetmax=.1)
                    yaxisopts=(offsetmin=0 offsetmax=.1 display=none);
     entry "Average Temp" / valign=top location=outside textattrs=GraphValueText(size=7pt);
     vectorplot x=norm y=AnnualNormalTemp  xorigin=norm yorigin=0 / arrowheads=false
       datatransparency=.5 lineattrs=(thickness=10px color=GraphData2:color);
     scatterplot x=norm y=eval(AnnualNormalTemp+10) / markercharacter=eval(put(AnnualNormalTemp,4.1))
       MARKERCHARACTERATTRS=(size=6pt);
     vectorplot x=act y=AnnualActualTemp xorigin=act yorigin=0 / arrowheads=false
       lineattrs=(thickness=10px color=black);
     scatterplot x=act y=eval(AnnualActualTemp+10) / markercharacter=eval(put(AnnualActualTemp,4.1))
       MARKERCHARACTERATTRS=(size=6pt);
   endlayout;
     referenceline x=start / lineattrs=GraphGridlines;
     bandplot x=date limitupper=MaxTempNormal limitLower=MinTempNormal/
       display=(fill) fillattrs=(color=GraphData4:color) datatransparency=.7;
     vectorplot x=date  y=MeanTemp xorigin=date yorigin=Maxtemp / arrowheads=false lineattrs=(color=GraphData2:color);
     vectorplot x=date  y=MeanTemp xorigin=date yorigin=Mintemp / arrowheads=false lineattrs=(color=GraphData1:color);
     scatterplot x=date y=MeanTemp / name="s" primary=true
       markerattrs=(symbol=circlefilled size=2px color=black) ;
     vectorplot xorigin=MaxTempDate yorigin=AnnualMaxTemp
       x=eval(maxTempDate -30) y=eval(AnnualMaxtemp -5) /
       datalabel=eval(catx(" ","High",put(AnnualMaxTemp,3.),
       put(MaxTempDate,monname3.),put(MaxTempDate,day2.)))
       arrowdirection=in;
     vectorplot xorigin=MinTempDate yorigin=AnnualMinTemp
       x=eval(minTempDate +30) y=eval(AnnualMintemp -5) /
       datalabel=eval(catx(" ","Low",put(AnnualMinTemp,3.),
       put(MinTempDate,monname3.),put(MinTempDate,day2.)))
       arrowdirection=in;
   endlayout;
   /* row 2 - precipitation */
   layout overlay / yaxisopts=(display=(tickvalues) displaysecondary=(tickvalues)
                    offsetmin=0 offsetmax=.1 griddisplay=on);
   /* inset for annual precipitation chart */
   layout overlay / width=80px height=80px halign=left valign=top border=true
                    walldisplay=(fill) opaque=true
                    xaxisopts=(display=(tickvalues) tickvalueattrs=GraphDataText
                    linearopts=(viewmin=.5 viewmax=2.5 tickvaluelist=(1 2))
                    offsetmin=.1 offsetmax=.1)
                    yaxisopts=(offsetmin=0 offsetmax=.1 display=none);
     entry "Total Precip" / valign=top location=outside textattrs=GraphValueText(size=7pt);
     vectorplot x=norm y=TotalNormalPrecip xorigin=norm yorigin=0 / arrowheads=false datatransparency=.5
       lineattrs=(thickness=10px color=GraphData2:color);
     scatterplot x=norm y=eval(TotalNormalPrecip+10) / markercharacter=eval(put(TotalNormalPrecip,5.2))
       MARKERCHARACTERATTRS=(size=5pt);
     vectorplot x=act y=TotalActualPrecip xorigin=act yorigin=0 / arrowheads=false
       lineattrs=(thickness=10px color=GraphData1:color) ;
     scatterplot x=act y=eval(TotalActualPrecip+10) / markercharacter=eval(put(TotalActualPrecip,5.2))
       MARKERCHARACTERATTRS=(size=5pt);
   endlayout;
     referenceline x=start / lineattrs=GraphGridlines;
     needleplot x=Normal y=NormalPrecip /name="N"  legendlabel="Normal"
       lineattrs=(thickness=26px color=GraphData2:color) datatransparency=.5 ;
     needleplot x=Actual y=ActualPrecip / name="A"   legendlabel="Actual"
       datalabel=eval(put(ActualPrecip-Normalprecip,diff6.))
       lineattrs=(thickness=13px color=GraphData1:Color)
       DataLabelATTRS=(size=5pt);
   endlayout;
   /* row 3 - humidity & dew point */
   layout overlay / yaxisopts=(display=(tickvalues)
                    offsetmin=0 offsetmax=0 griddisplay=on
                    linearopts=(viewmin=0 viewmax=1.1 tickvalueformat=percent.
                    tickvaluesequence=(start=0 end=1 increment=.25) ))
                    y2axisopts=(display=all offsetmin=0 offsetmax=.1 label="Dew point" labelattrs=(weight=bold)
                    linearopts=(viewmin=0 viewmax=100  tickvalueformat=degfmt.));
     referenceline x=start / lineattrs=GraphGridlines;
     bandplot x=date limitupper=eval(meanHumidity*.01) limitlower=0 / display=all
       datatransparency=.5 name="humid" legendlabel="Mean Relative Humidity"
       fillattrs=GraphData7 outlineattrs=GraphData7(pattern=solid);
       bandplot x=date limitupper=meanDew limitlower=0 / yaxis=y2  display=all
       datatransparency=.5    name="dew" legendlabel="Mean Dew Point"
       fillattrs=GraphData6 outlineattrs=GraphData6(pattern=solid);
       discretelegend "humid" "dew" /
       halign=center valign=bottom opaque=true location=inside;
   endlayout;
   endlayout;
  endgraph;
  end;
run;

proc format;
  value temptype 1="Normal" 2="Actual";
  picture degfmt low-high="009°";
  picture diff low-<0="09.99" (prefix="-")
               0="9"
              >0-high=09.99 (prefix="+");
run;

proc template;
  define Style weatherstyle;
  parent = styles.listing;
  style GraphFonts from GraphFonts
    "Fonts used in graph styles" /
       'GraphTitleFont' = (", ",10pt,bold)
       'GraphLabelFont' = (", ",9pt)
       'GraphValueFont' = (", ",8pt)
       'GraphDataFont' = (", ",7pt)
       ;
  end;
run;

ods listing close;
ods html style=weatherstyle image_dpi=100 file='weather.html' path='.';

ods graphics / reset imagename="GTLHandout_Weather" labelmax=500
               antialiasmax=10000 imagefmt=gif;

/* Click on the Download tab to download the data set. */
/* Specify the path where the WEATHER data set was downloaded. */
libname x 'path where data set WEATHER is stored';
proc sgrender data=x.fusion_35177_2_weather template=weather;
  format meantemp meandew degfmt. act norm temptype.;
run;

ods html close;
ods listing;
These sample files and code examples are provided by SAS Institute Inc. "as is" without warranty of any kind, either express or implied, including but not limited to the implied warranties of merchantability and fitness for a particular purpose. Recipients acknowledge and agree that SAS Institute shall not be liable for any damages whatsoever arising out of their use of this material. In addition, SAS Institute will provide no support for the materials contained herein.
This samples uses the Graph Template Language (GTL) to produce a three-row lattice layout.
| Type: | Sample |
| Topic: | SAS Reference ==> Procedures ==> SGRENDER Query and Reporting ==> Creating Reports ==> Graphical ==> Graph Template Language (GTL) |
| Date Modified: | 2009-03-19 12:43:23 |
| Date Created: | 2009-03-18 09:55:05 |
Operating System and Release Information
| Product Family | Product | Host | SAS Release | |
| Starting | Ending | |||
| SAS System | SAS/GRAPH | z/OS | 9.2 TS1M0 | |
| Microsoft® Windows® for 64-Bit Itanium-based Systems | 9.2 TS1M0 | |||
| Microsoft Windows Server 2003 Datacenter 64-bit Edition | 9.2 TS1M0 | |||
| Microsoft Windows Server 2003 Enterprise 64-bit Edition | 9.2 TS1M0 | |||
| Microsoft Windows XP 64-bit Edition | 9.2 TS1M0 | |||
| Microsoft® Windows® for x64 | 9.2 TS1M0 | |||
| Microsoft Windows Server 2003 Datacenter Edition | 9.2 TS1M0 | |||
| Microsoft Windows Server 2003 Enterprise Edition | 9.2 TS1M0 | |||
| Microsoft Windows Server 2003 Standard Edition | 9.2 TS1M0 | |||
| Microsoft Windows XP Professional | 9.2 TS1M0 | |||
| Windows Vista | 9.2 TS1M0 | |||
| 64-bit Enabled AIX | 9.2 TS1M0 | |||
| 64-bit Enabled HP-UX | 9.2 TS1M0 | |||
| 64-bit Enabled Solaris | 9.2 TS1M0 | |||
| HP-UX IPF | 9.2 TS1M0 | |||
| Linux | 9.2 TS1M0 | |||
| Linux for x64 | 9.2 TS1M0 | |||
| OpenVMS on HP Integrity | 9.2 TS1M0 | |||
| Solaris for x64 | 9.2 TS1M0 | |||