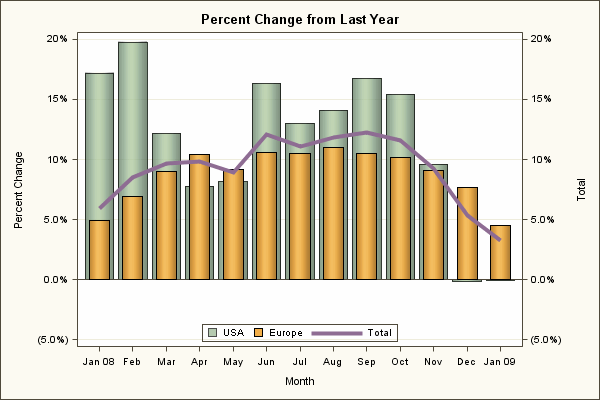
Sample 35174: Bar Chart with a Series Plot Overlay
 |  |  |  |  |
This sample uses the Graph Template Language (GTL) to produce a bar chart with a series plot overlay. A single overlay layout creates two regions which are represented by the bar charts and a series plot.
These sample files and code examples are provided by SAS Institute Inc. "as is" without warranty of any kind, either express or implied, including but not limited to the implied warranties of merchantability and fitness for a particular purpose. Recipients acknowledge and agree that SAS Institute shall not be liable for any damages whatsoever arising out of their use of this material. In addition, SAS Institute will provide no support for the materials contained herein.
This sample uses the Graph Template Language (GTL) to produce a bar chart with a series plot overlay. A single overlay layout creates two regions which are represented by the bar charts and a series plot.
proc format;
  value mth 1='Jan 08'
            2='Feb'
	    3='Mar'
            4='Apr'
            5='May'
            6='Jun'
            7='Jul'
            8='Aug'
            9='Sep'
            10='Oct'
	    11='Nov'
            12='Dec'
	    13='Jan 09';
run;

data trend;
  input month pn8 pr8 pt8;
  label month='Month';
  label pn8='USA';
  label pr8='Europe';
  label pt8='Total';
  format month mth.;
  format pn8 pr8 pt8 percent6.1;
  pn8=pn8-1;
  pt8=pt8-1;
  pr8=pr8-1;
  datalines;
 1 1.17195 1.04880 1.05943
 2 1.19779 1.06914 1.08467
 3 1.12158 1.09027 1.09648
 4 1.07787 1.10394 1.09846
 5 1.08135 1.09167 1.08935
 6 1.16316 1.10599 1.12094
 7 1.12977 1.10478 1.11108
 8 1.14117 1.10988 1.11798
 9 1.16774 1.10500 1.12222
10 1.15431 1.10135 1.11570
11 1.09570 1.09093 1.09223
12 0.99802 1.07659 1.05319
13 0.99914 1.04472 1.03230
;
run;

proc transpose data=trend out=trendGrp(rename=(_LABEL_=Group col1=Value) drop=_name_);
  by month;
  var pn8 pr8 pt8;
run;

proc template;
  define statgraph dashboard.trend;
  begingraph / designwidth=600px designheight=400px;
  entrytitle 'Percent Change from Last Year';
    layout overlay / cycleattrs=true
                     yaxisopts=(griddisplay=on label='Percent Change' linearopts=(viewmin=-0.05))
                     y2axisopts=(label='Total' linearopts=(viewmin=-0.05 viewmax=0.2));
      barchart x=month y=pn8 / /* barlabel=true*/ skin=modern datatransparency=0.3 name='bar1';
      barchart x=month y=pr8 / skin=modern barwidth=0.6 name='bar2';
      seriesplot x=month y=pt8 / lineattrs=graphData5(thickness=4 pattern=solid) yaxis=y2 name='line';
      discretelegend 'bar1' 'bar2' 'line' / location=inside valign=bottom halign=center;
    endlayout;
  endgraph;
  end;
run;

proc template;
  define Style TrendStyle;
  parent = styles.analysis;
  style GraphFonts from GraphFonts
    "Fonts used in graph styles" /
    'GraphTitleFont' = (", ",10pt,bold)
    'GraphFootnoteFont' = (", ",8pt)
    'GraphLabelFont' = (", ",8pt)
    'GraphValueFont' = (", ",7pt)
    'GraphDataFont' = (", ",7pt);
  end;
run;

ods listing close;
ods html style=TrendStyle image_dpi=100 file='trend.html' path='.';

ods graphics / reset imagename='GTLHandout_Trend' imagefmt=gif;
proc sgrender data=trend template=dashboard.trend;
run;

ods html close;
ods listing;
These sample files and code examples are provided by SAS Institute Inc. "as is" without warranty of any kind, either express or implied, including but not limited to the implied warranties of merchantability and fitness for a particular purpose. Recipients acknowledge and agree that SAS Institute shall not be liable for any damages whatsoever arising out of their use of this material. In addition, SAS Institute will provide no support for the materials contained herein.
This sample uses the Graph Template Language (GTL) to produce a bar chart with a series plot overlay.
| Type: | Sample |
| Topic: | SAS Reference ==> Procedures ==> SGRENDER Query and Reporting ==> Creating Reports ==> Graphical ==> Graph Template Language (GTL) |
| Date Modified: | 2009-03-19 10:34:29 |
| Date Created: | 2009-03-17 17:45:19 |
Operating System and Release Information
| Product Family | Product | Host | SAS Release | |
| Starting | Ending | |||
| SAS System | SAS/GRAPH | z/OS | 9.2 TS2M0 | |
| Microsoft® Windows® for 64-Bit Itanium-based Systems | 9.2 TS2M0 | |||
| Microsoft Windows Server 2003 Datacenter 64-bit Edition | 9.2 TS2M0 | |||
| Microsoft Windows Server 2003 Enterprise 64-bit Edition | 9.2 TS2M0 | |||
| Microsoft Windows XP 64-bit Edition | 9.2 TS2M0 | |||
| Microsoft® Windows® for x64 | 9.2 TS2M0 | |||
| Microsoft Windows Server 2003 Datacenter Edition | 9.2 TS2M0 | |||
| Microsoft Windows Server 2003 Enterprise Edition | 9.2 TS2M0 | |||
| Microsoft Windows Server 2003 Standard Edition | 9.2 TS2M0 | |||
| Microsoft Windows XP Professional | 9.2 TS2M0 | |||
| Windows Vista | 9.2 TS2M0 | |||
| 64-bit Enabled AIX | 9.2 TS2M0 | |||
| 64-bit Enabled HP-UX | 9.2 TS2M0 | |||
| 64-bit Enabled Solaris | 9.2 TS2M0 | |||
| HP-UX IPF | 9.2 TS2M0 | |||
| Linux | 9.2 TS2M0 | |||
| Linux for x64 | 9.2 TS2M0 | |||
| OpenVMS on HP Integrity | 9.2 TS2M0 | |||
| Solaris for x64 | 9.2 TS2M0 | |||