Sample 35172: Distribution plot
 |  |  |  |  |
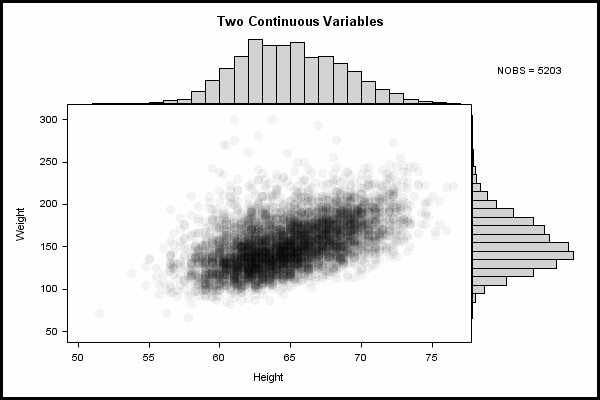
This sample uses the Graph Template Language (GTL) to produce a distribution plot. It uses a four-cell lattice layout in a 2x2 configuration with scatter plots and histograms.
These sample files and code examples are provided by SAS Institute Inc. "as is" without warranty of any kind, either express or implied, including but not limited to the implied warranties of merchantability and fitness for a particular purpose. Recipients acknowledge and agree that SAS Institute shall not be liable for any damages whatsoever arising out of their use of this material. In addition, SAS Institute will provide no support for the materials contained herein.
This sample uses the Graph Template Language (GTL) to produce a distribution plot. It uses a four-cell lattice layout in a 2x2 configuration with scatter plots and histograms.
proc template;
  define statgraph scatterhist;
  dynamic XVAR YVAR XTYPE YTYPE TITLE;
  begingraph / designwidth=600px designheight=400px borderattrs=(thickness=3px);
    entrytitle TITLE;
    layout lattice / rows=2 columns=2 rowweights=(.2 .8) columnweights=(.8 .2)
                     rowdatarange=union columndatarange=union rowgutter=0 columngutter=0;
  /* histogram or barchart at X2 axis position */
    layout overlay / walldisplay=(fill) wallcolor=GraphBackground:color
                     xaxisopts=(display=none)
                     yaxisopts=(display=none offsetmin=0);
      if (upcase(XTYPE) = "DISCRETE")
        barchart x=XVAR / barwidth=1 stat=pct;
      else
        histogram XVAR / binaxis=false;
      endif;
    endlayout;
  /* NOBS count cell */
    layout overlay;
      entry 'NOBS = ' eval(n(XVAR));
    endlayout;
  /* scatter plot with conditional axis types */
    layout overlay / xaxisopts=(type=XTYPE) yaxisopts=(type=YTYPE);
      scatterplot y=YVAR x=XVAR / datatransparency=.95 markerattrs=(symbol=circlefilled size=11px);
    endlayout;
  /* histogram or barchart at Y2 axis position */
    layout overlay / walldisplay=(fill) wallcolor=GraphBackground:color
                     xaxisopts=(display=none offsetmin=0) yaxisopts=(display=none);
      if (upcase(YTYPE) = "DISCRETE") barchart x=YVAR / barwidth=1 orient=horizontal stat=pct;
      else histogram YVAR / orient=horizontal binaxis=false;
      endif;
    endlayout;
    endlayout;
  endgraph;
  end;
run;

proc template;
  define Style ScatterHistStyle;
  parent = styles.journal;
  style GraphFonts from GraphFonts
    "Fonts used in graph styles" /
    'GraphTitleFont' = (", ",10pt,bold)
    'GraphFootnoteFont' = (", ",8pt)
    'GraphLabelFont' = (", ",8pt)
    'GraphValueFont' = (", ",7pt)
    'GraphDataFont' = (", ",7pt);
  end;
run;

ods listing close;
ods html style=ScatterHistStyle image_dpi=100 file='scatterhist.html' path='.';

ods graphics / reset imagename='GTLHandout_ScatterHist' antialiasmax=10000 imagefmt=gif;
proc sgrender data=sashelp.heart template=scatterhist;
  dynamic YVAR="weight" XVAR="height" title="Two Continuous Variables";
run;

ods html close;
ods listing;
These sample files and code examples are provided by SAS Institute Inc. "as is" without warranty of any kind, either express or implied, including but not limited to the implied warranties of merchantability and fitness for a particular purpose. Recipients acknowledge and agree that SAS Institute shall not be liable for any damages whatsoever arising out of their use of this material. In addition, SAS Institute will provide no support for the materials contained herein.
This sample uses the Graph Template Language (GTL) to produce a distribution plot. It uses a four-cell lattice layout in a 2x2 configuration with scatter plots and histograms.
| Type: | Sample |
| Topic: | SAS Reference ==> Procedures ==> SGRENDER Query and Reporting ==> Creating Reports ==> Graphical ==> Graph Template Language (GTL) Query and Reporting ==> Creating Reports ==> Graphical ==> Health and Life Sciences Industry |
| Date Modified: | 2009-03-19 10:23:35 |
| Date Created: | 2009-03-17 17:17:45 |
Operating System and Release Information
| Product Family | Product | Host | SAS Release | |
| Starting | Ending | |||
| SAS System | SAS/GRAPH | z/OS | 9.2 TS1M0 | |
| Microsoft® Windows® for 64-Bit Itanium-based Systems | 9.2 TS1M0 | |||
| Microsoft Windows Server 2003 Datacenter 64-bit Edition | 9.2 TS1M0 | |||
| Microsoft Windows Server 2003 Enterprise 64-bit Edition | 9.2 TS1M0 | |||
| Microsoft Windows XP 64-bit Edition | 9.2 TS1M0 | |||
| Microsoft® Windows® for x64 | 9.2 TS1M0 | |||
| Microsoft Windows Server 2003 Datacenter Edition | 9.2 TS1M0 | |||
| Microsoft Windows Server 2003 Enterprise Edition | 9.2 TS1M0 | |||
| Microsoft Windows Server 2003 Standard Edition | 9.2 TS1M0 | |||
| Microsoft Windows XP Professional | 9.2 TS1M0 | |||
| Windows Vista | 9.2 TS1M0 | |||
| 64-bit Enabled AIX | 9.2 TS1M0 | |||
| 64-bit Enabled HP-UX | 9.2 TS1M0 | |||
| 64-bit Enabled Solaris | 9.2 TS1M0 | |||
| HP-UX IPF | 9.2 TS1M0 | |||
| Linux | 9.2 TS1M0 | |||
| Linux for x64 | 9.2 TS1M0 | |||
| OpenVMS on HP Integrity | 9.2 TS1M0 | |||
| Solaris for x64 | 9.2 TS1M0 | |||