Sample 35171: Histogram with Normal and Kernel Density Curves
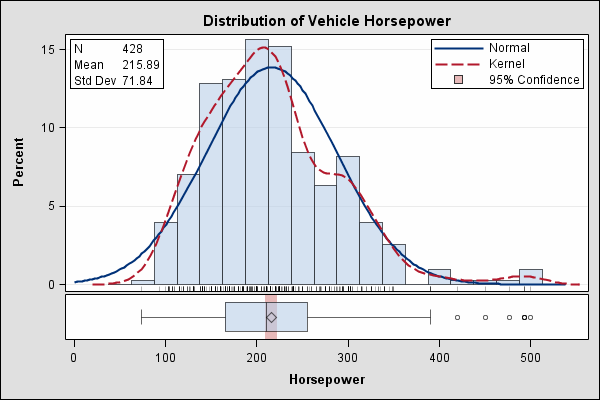
This sample uses the Graph Template Language (GTL) to produce a distribution plot. It uses a two-row lattice layout. The upper cell contains a histogram with normal and kernel density curves, a legend, and a table. The lower cell contains a horizontal box plot and a band plot.
These sample files and code examples are provided by SAS Institute
Inc. "as is" without warranty of any kind, either express or implied, including
but not limited to the implied warranties of merchantability and fitness for a
particular purpose. Recipients acknowledge and agree that SAS Institute shall
not be liable for any damages whatsoever arising out of their use of this material.
In addition, SAS Institute will provide no support for the materials contained herein.
This sample uses the Graph Template Language (GTL) to produce a distribution plot. It uses a two-row lattice layout. The upper cell contains a histogram with normal and kernel density curves, a legend, and a table. The lower cell contains a horizontal box plot and a band plot.
proc template;
  define statgraph SGF2009.Histogram;
  begingraph / designwidth=600px designheight=400px;
    entrytitle "Distribution of Vehicle Horsepower";
      layout lattice / rowweights=(.85 .15) columndatarange=union rowgutter=2px;
        columnaxes;
          columnaxis / display=(ticks tickvalues label) label='Horsepower';
        endcolumnaxes;
      layout overlay / yaxisopts=(offsetmin=.03 griddisplay=auto_on);
      layout gridded / columns=2 autoalign=(topleft) border=true
                       opaque=true backgroundcolor=GraphWalls:color;
      entry halign=left "N";       entry halign=left eval(strip(put(n(horsepower),12.0)));
      entry halign=left "Mean";    entry halign=left eval(strip(put(mean(horsepower),12.2)));
      entry halign=left "Std Dev"; entry halign=left eval(strip(put(stddev(horsepower),12.2)));
      endlayout;
      histogram horsepower / scale=percent primary=true binaxis=false nbins=20 datatransparency=0.4;
      densityplot horsepower / normal( ) name="norm" legendlabel="Normal";
      densityplot horsepower / kernel( ) name="kern" legendlabel="Kernel" lineattrs=graphdata2(thickness=2px);
      fringeplot horsepower / datatransparency=.7 fringeheight=5px;
      discretelegend "norm" "kern" "band" / location=inside across=1 autoalign=(topright) opaque=true;
      endlayout;
      layout overlay;
        bandplot y=horsepower limitlower=eval(lclm(horsepower)) limitupper=eval(uclm(horsepower)) /
               yaxis=y2 extend=true display=(fill) fillattrs=GraphConfidence2
               name="band" legendlabel="95% Confidence";
        boxplot y=horsepower / orient=horizontal primary=true boxwidth=.9 datatransparency=0.4;
      endlayout;
    endlayout;
  endgraph;
  end;
run;

ods listing close;
ods html style=default image_dpi=100 file='histogram.html' path='.';

ods graphics / reset imagename="GTLHandout_Histogram" imagefmt=gif;
proc sgrender data=sashelp.cars template=SGF2009.Histogram ;
run;

ods html close;
ods listing;
These sample files and code examples are provided by SAS Institute
Inc. "as is" without warranty of any kind, either express or implied, including
but not limited to the implied warranties of merchantability and fitness for a
particular purpose. Recipients acknowledge and agree that SAS Institute shall
not be liable for any damages whatsoever arising out of their use of this material.
In addition, SAS Institute will provide no support for the materials contained herein.
This sample uses the Graph Template Language (GTL) to produce a histogram with normal and kernel density curves,
| Type: | Sample |
| Topic: | SAS Reference ==> Procedures ==> SGRENDER
Query and Reporting ==> Creating Reports ==> Graphical ==> Graph Template Language (GTL)
|
| Date Modified: | 2009-03-19 10:29:49 |
| Date Created: | 2009-03-17 16:58:18 |
Operating System and Release Information
| SAS System | SAS/GRAPH | z/OS | 9.2 TS1M0 | |
| Microsoft® Windows® for 64-Bit Itanium-based Systems | 9.2 TS1M0 | |
| Microsoft Windows Server 2003 Datacenter 64-bit Edition | 9.2 TS1M0 | |
| Microsoft Windows Server 2003 Enterprise 64-bit Edition | 9.2 TS1M0 | |
| Microsoft Windows XP 64-bit Edition | 9.2 TS1M0 | |
| Microsoft® Windows® for x64 | 9.2 TS1M0 | |
| Microsoft Windows Server 2003 Datacenter Edition | 9.2 TS1M0 | |
| Microsoft Windows Server 2003 Enterprise Edition | 9.2 TS1M0 | |
| Microsoft Windows Server 2003 Standard Edition | 9.2 TS1M0 | |
| Microsoft Windows XP Professional | 9.2 TS1M0 | |
| Windows Vista | 9.2 TS1M0 | |
| 64-bit Enabled AIX | 9.2 TS1M0 | |
| 64-bit Enabled HP-UX | 9.2 TS1M0 | |
| 64-bit Enabled Solaris | 9.2 TS1M0 | |
| HP-UX IPF | 9.2 TS1M0 | |
| Linux | 9.2 TS1M0 | |
| Linux for x64 | 9.2 TS1M0 | |
| OpenVMS on HP Integrity | 9.2 TS1M0 | |
| Solaris for x64 | 9.2 TS1M0 | |


