Sample 35168: Scatter Plot with Regression Line
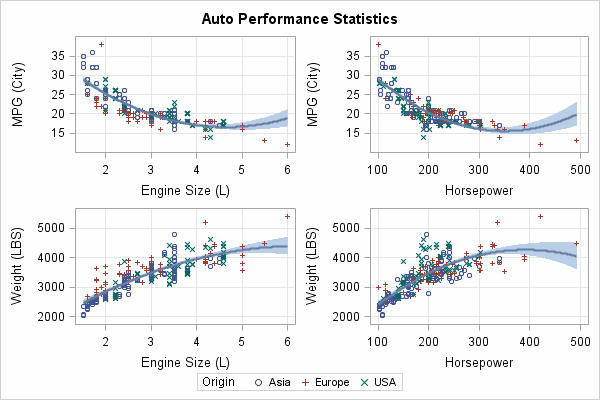
The sample code on the Full Code tab uses the SGSCATTER procedure to produce scatter plots with data points and a regression line.
These sample files and code examples are provided by SAS Institute
Inc. "as is" without warranty of any kind, either express or implied, including
but not limited to the implied warranties of merchantability and fitness for a
particular purpose. Recipients acknowledge and agree that SAS Institute shall
not be liable for any damages whatsoever arising out of their use of this material.
In addition, SAS Institute will provide no support for the materials contained herein.
This sample uses the SGSCATTER procedure to produce scatter plots with data points and a regression line.
ods listing close;
ods html file='Scatterplot.html' path='.' style=statistical;
ods graphics / reset width=600px height=400px imagename='ScatterPlot' imagefmt=gif;

title "Auto Performance Statistics";
proc sgscatter data=sashelp.cars;
  /* Subset the data set for only the Sedan types */
  where type='Sedan';

  /* Create a paneled graph of four individual plots;
     plot of miles per gallon in the city for engine size,
     miles per gallon in the city for horsepower,
     vehicle weight for engine size, and
     vehicle weight for horse power.
     Create a separate line for each car origin.
     Add a regression fit to the scatter plot.  */
  plot (mpg_city weight) * (enginesize horsepower) /
        group=origin reg=(nogroup clm degree=2) grid ;
run;

ods html close;
ods listing;
These sample files and code examples are provided by SAS Institute
Inc. "as is" without warranty of any kind, either express or implied, including
but not limited to the implied warranties of merchantability and fitness for a
particular purpose. Recipients acknowledge and agree that SAS Institute shall
not be liable for any damages whatsoever arising out of their use of this material.
In addition, SAS Institute will provide no support for the materials contained herein.
This sample uses the SGSCATTER procedure to produce scatter plots with data points and a regression line.
| Type: | Sample |
| Topic: | SAS Reference ==> Procedures ==> SGSCATTER
|
| Date Modified: | 2009-03-20 15:03:52 |
| Date Created: | 2009-03-17 15:03:34 |
Operating System and Release Information
| SAS System | SAS/GRAPH | z/OS | 9.2 TS1M0 | |
| Microsoft® Windows® for 64-Bit Itanium-based Systems | 9.2 TS1M0 | |
| Microsoft Windows Server 2003 Datacenter 64-bit Edition | 9.2 TS1M0 | |
| Microsoft Windows Server 2003 Enterprise 64-bit Edition | 9.2 TS1M0 | |
| Microsoft Windows XP 64-bit Edition | 9.2 TS1M0 | |
| Microsoft® Windows® for x64 | 9.2 TS1M0 | |
| Microsoft Windows Server 2003 Datacenter Edition | 9.2 TS1M0 | |
| Microsoft Windows Server 2003 Enterprise Edition | 9.2 TS1M0 | |
| Microsoft Windows Server 2003 Standard Edition | 9.2 TS1M0 | |
| Microsoft Windows XP Professional | 9.2 TS1M0 | |
| Windows Vista | 9.2 TS1M0 | |
| 64-bit Enabled AIX | 9.2 TS1M0 | |
| 64-bit Enabled HP-UX | 9.2 TS1M0 | |
| 64-bit Enabled Solaris | 9.2 TS1M0 | |
| HP-UX IPF | 9.2 TS1M0 | |
| Linux | 9.2 TS1M0 | |
| Linux for x64 | 9.2 TS1M0 | |
| OpenVMS on HP Integrity | 9.2 TS1M0 | |
| Solaris for x64 | 9.2 TS1M0 | |


