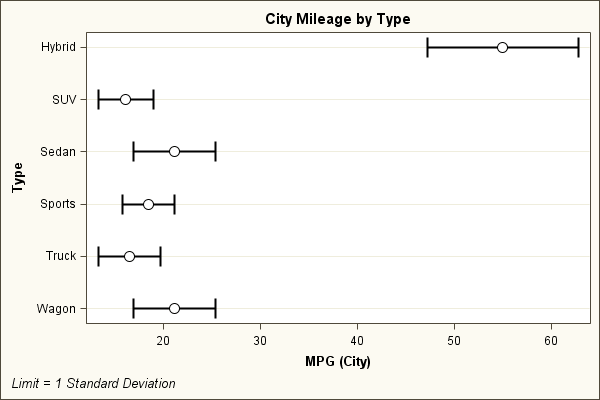
Sample 35166: Dot Plot with Standard Deviation
This sample uses the SGPLOT procedure to create a dot plot with standard deviation.
These sample files and code examples are provided by SAS Institute
Inc. "as is" without warranty of any kind, either express or implied, including
but not limited to the implied warranties of merchantability and fitness for a
particular purpose. Recipients acknowledge and agree that SAS Institute shall
not be liable for any damages whatsoever arising out of their use of this material.
In addition, SAS Institute will provide no support for the materials contained herein.
This sample uses the SGPLOT procedure to create a dot plot with standard deviation.
ods listing close;
ods html file='DotPlot.html' path='.' style=analysis;
ods graphics / reset width=600px height=400px imagename='DotPlot' imagefmt=gif;

title 'City Mileage by Type';
footnote j=left 'Limit = 1 Standard Deviation';
proc sgplot data=sashelp.cars nocycleattrs noautolegend;
  dot type / response=mpg_city limitstat=stddev limits=both stat=mean
             limitattrs=(thickness=2) markerattrs=(color=black size=13 symbol=circlefilled);
  dot type / response=mpg_city stat=mean
             markerattrs=(color=white size=10 symbol=circlefilled);
run;

ods html close;
ods listing;
These sample files and code examples are provided by SAS Institute
Inc. "as is" without warranty of any kind, either express or implied, including
but not limited to the implied warranties of merchantability and fitness for a
particular purpose. Recipients acknowledge and agree that SAS Institute shall
not be liable for any damages whatsoever arising out of their use of this material.
In addition, SAS Institute will provide no support for the materials contained herein.
This sample uses the SGPLOT procedure to create a dot plot with standard deviation.
| Type: | Sample |
| Topic: | SAS Reference ==> Procedures ==> SGPLOT
|
| Date Modified: | 2009-03-20 14:41:59 |
| Date Created: | 2009-03-17 14:30:19 |
Operating System and Release Information
| SAS System | SAS/GRAPH | z/OS | 9.2 TS2M0 | |
| Microsoft® Windows® for 64-Bit Itanium-based Systems | 9.2 TS2M0 | |
| Microsoft Windows Server 2003 Datacenter 64-bit Edition | 9.2 TS2M0 | |
| Microsoft Windows Server 2003 Enterprise 64-bit Edition | 9.2 TS2M0 | |
| Microsoft Windows XP 64-bit Edition | 9.2 TS2M0 | |
| Microsoft® Windows® for x64 | 9.2 TS2M0 | |
| Microsoft Windows Server 2003 Datacenter Edition | 9.2 TS2M0 | |
| Microsoft Windows Server 2003 Enterprise Edition | 9.2 TS2M0 | |
| Microsoft Windows Server 2003 Standard Edition | 9.2 TS2M0 | |
| Microsoft Windows XP Professional | 9.2 TS2M0 | |
| Windows Vista | 9.2 TS2M0 | |
| 64-bit Enabled AIX | 9.2 TS2M0 | |
| 64-bit Enabled HP-UX | 9.2 TS2M0 | |
| 64-bit Enabled Solaris | 9.2 TS2M0 | |
| HP-UX IPF | 9.2 TS2M0 | |
| Linux | 9.2 TS2M0 | |
| Linux for x64 | 9.2 TS2M0 | |
| OpenVMS on HP Integrity | 9.2 TS2M0 | |
| Solaris for x64 | 9.2 TS2M0 | |


