Sample 35143: Forest plot
 |  |  |  |  |
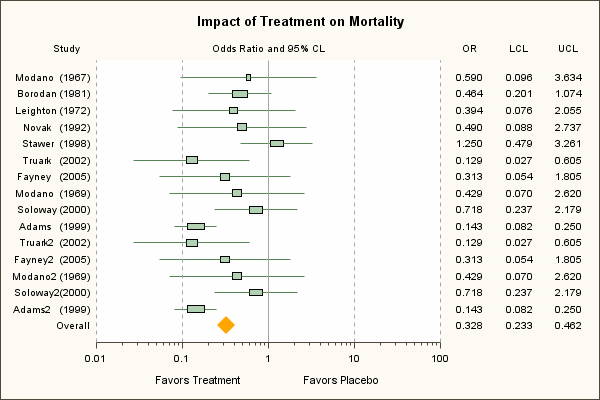
This sample uses the Graph Template Language (GTL) to produce a forest plot. The graph shows the effectiveness of a treatment based on multiple studies. The graph uses a five-column lattice layout. The second cell is a box plot showing the odds ratio and the confidence intervals. The other columns display various statistics.
The values for the OFFSETMIN and OFFSETMAX axis options are calculated in the DATA _NULL_ data step and saved in the PCT macro variable. In order to use this variable in the GTL, it is referenced on the DYNAMIC statement in the PROC TEMPLATE code. The PROC SGRENDER code specifies the value of the macro variable in a DYNAMIC statement.
These sample files and code examples are provided by SAS Institute Inc. "as is" without warranty of any kind, either express or implied, including but not limited to the implied warranties of merchantability and fitness for a particular purpose. Recipients acknowledge and agree that SAS Institute shall not be liable for any damages whatsoever arising out of their use of this material. In addition, SAS Institute will provide no support for the materials contained herein.
This sample uses the Graph Template Language (GTL) to produce a forest plot. The graph shows the effectiveness of a treatment based on multiple studies. The graph uses a five-column lattice layout. The second cell is a box plot showing the odds ratio and the confidence intervals. The other columns display various statistics.
The values for the OFFSETMIN and OFFSETMAX axis options are calculated in the DATA _NULL_ data step and saved in the PCT macro variable. In order to use this variable in the GTL, it is referenced on the DYNAMIC statement in the PROC TEMPLATE code. The PROC SGRENDER code specifies the value of the macro variable in a DYNAMIC statement.
data meta(keep=Study Stat Value)
     overall(keep=overall overallvalue)
     labels(keep=Study2 OddsRatio LowerCL UpperCl constant);
  input Study $1-16 OddsRatio LowerCL UpperCL Weight;
  length Stat $8;
  format  OddsRatio LowerCL UpperCL 5.3;
  retain constant 1;
  Study2=right(Study);
  output Labels;
  if Study eq "Overall" then do;
    OverallValue=OddsRatio;
    Overall="Overall";
    output overall;
  end;
  else do;
    weight=weight*.05;
    Stat="MIN";
    Value=LowerCL;
    output meta;
    Stat="MAX";
    Value=UpperCL;
    output meta;
    Stat="Q1";
    Value= OddsRatio/(10 ** (weight/2));
    output meta;
    Stat="Q3";
   Value= OddsRatio*(10 ** (weight/2));
    output meta;
    Stat="BOXWIDTH";
    Value=weight*3;
    output meta;
  end;
  datalines;
Modano  (1967)    0.590 0.096 3.634  1
Borodan (1981)    0.464 0.201 1.074  3.5
Leighton (1972)   0.394 0.076 2.055  2
Novak   (1992)    0.490 0.088 2.737  2
Stawer  (1998)    1.250 0.479 3.261  3
Truark   (2002)   0.129 0.027 0.605  2.5
Fayney   (2005)   0.313 0.054 1.805  2
Modano  (1969)    0.429 0.070 2.620  2
Soloway (2000)    0.718 0.237 2.179  3
Adams   (1999)    0.143 0.082 0.250  4
Truark2  (2002)   0.129 0.027 0.605  2.5
Fayney2  (2005)   0.313 0.054 1.805  2
Modano2 (1969)    0.429 0.070 2.620  2
Soloway2(2000)    0.718 0.237 2.179  3
Adams2   (1999)    0.143 0.082 0.250  4
Overall           0.328 0.233 0.462  .
;
run;

data forest;
  merge meta overall labels;
run;

data _null_;
  pct=1/nobs;
  call symputx("pct", pct);
  set labels nobs=nobs;
run;

proc template;
  define statgraph ForestPlot_2Col;
  dynamic _pct;
  begingraph / designwidth=600px designheight=400px;
  entrytitle "Impact of Treatment on Mortality" / pad=(bottom=5px);
  layout lattice / columns=2 columngutter=0 columnweights=(.76 .24 );

    layout overlay / walldisplay=(fill)
                   yaxisopts=(display=(tickvalues) reverse=true offsetmin=_pct offsetmax=_pct)
                   xaxisopts=(type=log offsetmin=0 offsetmax=0
		           label="Favors Treatment                     Favors Placebo"
                   logopts=(base=10 minorticks=true viewmin=.01 viewmax=100 ));
      entry halign=left "             Study"
            halign=center "Odds Ratio and 95% CL" / location=outside valign=top ;
      boxplotparm x=Study y=value stat=stat / orient=horizontal display=(fill notches);
      scatterplot x=OverallValue y=overall / markerattrs=(color=orange symbol=diamondfilled size=4pct);
	  referenceline x=1 / lineattrs=(pattern=solid);
      referenceline x=.1 / lineattrs=(pattern=shortdash);
      referenceline x=10 / lineattrs=(pattern=shortdash);
      referenceline x=.01 / lineattrs=(pattern=shortdash);
      referenceline x=100 / lineattrs=(pattern=shortdash);
    endlayout;

    layout overlay / walldisplay=none border=false
                   yaxisopts=(reverse=true type=discrete display=none)
                   xaxisopts=(display=none offsetmin=0.15 offsetmax=0.15);
      entry  halign=left "   OR" halign=center "  LCL" halign=right "UCL" / pad=(right=2.75%) location=outside valign=top;
      scatterplot y=Study2 x=eval(constant*1) / markercharacter=OddsRatio;
	  scatterplot y=Study2 x=eval(constant*2) / markercharacter=LowerCL;
	  scatterplot y=Study2 x=eval(constant*3) / markercharacter=UpperCL;
    endlayout;

  endlayout;
  endgraph;
  end;
run;

proc template;
  define Style foreststyle;
    parent = styles.analysis;
    style GraphFonts from GraphFonts
      "Fonts used in graph styles" /
      'GraphTitleFont' = (", ",10pt,bold)
      'GraphLabelFont' = (", ",8pt)
      'GraphValueFont' = (", ",7pt)
      'GraphDataFont' = (", ",7pt);
  end;
run;

title;
options nodate nonumber;

ods listing close;
ods html image_dpi=100 style=foreststyle file='forestplot_2Col.html' path='.';

ods graphics / reset imagename="ForestPlot_2Col" imagefmt=gif;
proc sgrender data=forest template=ForestPlot_2Col;
  dynamic _pct=&pct;
run;

ods html close;
ods listing;
These sample files and code examples are provided by SAS Institute Inc. "as is" without warranty of any kind, either express or implied, including but not limited to the implied warranties of merchantability and fitness for a particular purpose. Recipients acknowledge and agree that SAS Institute shall not be liable for any damages whatsoever arising out of their use of this material. In addition, SAS Institute will provide no support for the materials contained herein.
This sample uses the Graph Template Language (GTL) to produce a forest plot.
| Type: | Sample |
| Topic: | SAS Reference ==> Procedures ==> SGRENDER Query and Reporting ==> Creating Reports ==> Graphical ==> Graph Template Language (GTL) Query and Reporting ==> Creating Reports ==> Graphical ==> Health and Life Sciences Industry |
| Date Modified: | 2009-03-19 09:56:48 |
| Date Created: | 2009-03-16 13:28:29 |
Operating System and Release Information
| Product Family | Product | Host | SAS Release | |
| Starting | Ending | |||
| SAS System | SAS/GRAPH | z/OS | 9.2 TS1M0 | |
| Microsoft® Windows® for 64-Bit Itanium-based Systems | 9.2 TS1M0 | |||
| Microsoft Windows Server 2003 Datacenter 64-bit Edition | 9.2 TS1M0 | |||
| Microsoft Windows Server 2003 Enterprise 64-bit Edition | 9.2 TS1M0 | |||
| Microsoft Windows XP 64-bit Edition | 9.2 TS1M0 | |||
| Microsoft® Windows® for x64 | 9.2 TS1M0 | |||
| Microsoft Windows Server 2003 Datacenter Edition | 9.2 TS1M0 | |||
| Microsoft Windows Server 2003 Enterprise Edition | 9.2 TS1M0 | |||
| Microsoft Windows Server 2003 Standard Edition | 9.2 TS1M0 | |||
| Microsoft Windows XP Professional | 9.2 TS1M0 | |||
| Windows Vista | 9.2 TS1M0 | |||
| 64-bit Enabled AIX | 9.2 TS1M0 | |||
| 64-bit Enabled HP-UX | 9.2 TS1M0 | |||
| 64-bit Enabled Solaris | 9.2 TS1M0 | |||
| HP-UX IPF | 9.2 TS1M0 | |||
| Linux | 9.2 TS1M0 | |||
| Linux for x64 | 9.2 TS1M0 | |||
| OpenVMS on HP Integrity | 9.2 TS1M0 | |||
| Solaris for x64 | 9.2 TS1M0 | |||