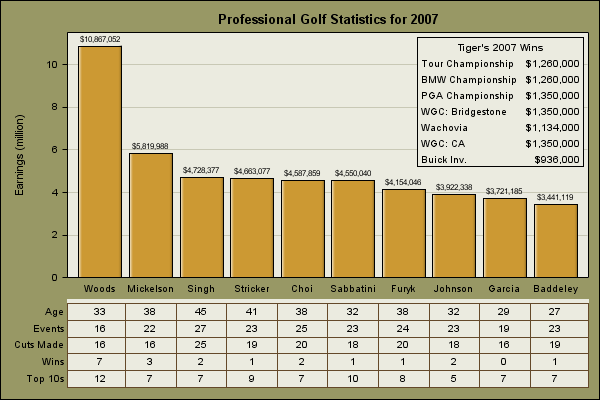
Sample 35132: Bar chart with a data table below the graph
 |  |  |  |  |
This sample uses the Graph Template Language (GTL) to produce a bar chart with a data table below the graph. The graph uses a two-row lattice layout, where the upper cell contains a labeled bar chart with an embedded table.
These sample files and code examples are provided by SAS Institute Inc. "as is" without warranty of any kind, either express or implied, including but not limited to the implied warranties of merchantability and fitness for a particular purpose. Recipients acknowledge and agree that SAS Institute shall not be liable for any damages whatsoever arising out of their use of this material. In addition, SAS Institute will provide no support for the materials contained herein.
This sample uses the Graph Template Language (GTL) to produce a bar chart with a data table below the graph. The graph uses a two-row lattice layout, where the upper cell contains a labeled bar chart with an embedded table.
proc template;
  define statgraph bartable ;
  mvar T1 T2 T3 T4 T5 T6 T7 T8 T9 P1 P2 P3 P4 P5 P6 P7 P8 P9;
  begingraph / designwidth=600px designheight=400px;
    entrytitle "Professional Golf Statistics for 2007";
    layout lattice / rows=2 rowgutter=0 rowweights=(.75 .25);
    layout overlay / xaxisopts=(display=(tickvalues))
           yaxisopts=(griddisplay=on
           linearopts=(tickvalueformat=(extractscale=true)) );
      /* inset table */
    layout gridded / valign=top halign=right border=true opaque=true backgroundcolor=GraphWalls:color;
	   entry "Tiger's 2007 Wins" / textattrs=(weight=bold);
    layout gridded /columns=2 opaque=true backgroundcolor=GraphWalls:color;
           entry halign=left T1; entry halign=right P1;
           entry halign=left T2; entry halign=right P2;
           entry halign=left T3; entry halign=right P3;
           entry halign=left T4; entry halign=right P4;
           entry halign=left T5; entry halign=right P5;
	   entry halign=left T6;	entry halign=right P6;
	   entry halign=left T7; entry halign=right P7;
    endlayout;
    endlayout;
    barchart x=LastName y=Earnings / barlabel=true barlabelformat=dollar12. fillattrs=graphdata1
           skin=satin outlineattrs=(color=black);
    endlayout;
    layout overlay / xaxisopts=(type=discrete display=none) walldisplay=(fill);
      blockplot x=LastName block=stat / class=statName display=(outline values label)
           valuehalign=right repeatedvalues=true labelattrs=(size=7pt);
    endlayout;
    endlayout;
  endgraph;
  end;
run;

data PGA2007;
  input Rank 2.  Player & $15. Age Events Rounds CutsMade Top10 Wins Earnings;
  length  LastName $10 StatName $10;
  keep Rank LastName Earnings StatName Stat;
  LastName=scan(Player,2,' ');
  label CutsMade="Cuts Made" Top10="Top 10s";
  format Earnings dollar12.;
  array sname{5} Age Events CutsMade Wins Top10;
    do i=1 to dim(sname);
      StatName=vlabel(sname{i});
      Stat=sname{i};
    if i>1 then earnings=.;
    output;
    end;
  datalines;
 1 Tiger Woods     33  16  61 16 12  7 10867052
 2 Phil Mickelson  38  22  73 16  7  3  5819988
 3 Vijay Singh     45  27 101 25  7  2  4728377
 4 Steve Stricker  41  23  80 19  9  1  4663077
 5 K.J. Choi       38  25  88 20  7  2  4587859
 6 Rory Sabbatini  32  23  80 18 10  1  4550040
 7 Jim Furyk       38  24  84 20  8  1  4154046
 8 Zach Johnson    32  23  78 18  5  2  3922338
 9 Sergio Garcia   29  19  67 16  7  0  3721185
10 Aaron Baddeley  27  23  82 19  7  1  3441119
run;

data TigerWins;
  input Tournament $1-17 Purse : comma12.;
  call symput(cats("T",_n_),strip(Tournament));
  call symput(cats("P",_n_),put(Purse,dollar11.));
  datalines;
Tour Championship $1,260,000
BMW Championship  $1,260,000
PGA Championship  $1,350,000
WGC: Bridgestone  $1,350,000
Wachovia          $1,134,000
WGC: CA           $1,350,000
Buick Inv.          $936,000
run;

proc template;
  define Style bartablestyle;
  parent = styles.blockprint;
  style GraphFonts from GraphFonts
    "Fonts used in graph styles" /
    'GraphTitleFont' = (", ",10pt,bold)
    'GraphLabelFont' = (", ",8pt)
    'GraphValueFont' = (", ",7pt)
    'GraphDataFont' = (", ",7pt);
  end;
run;

options nodate nonumber;
title;

ods listing close;
ods html file="bartable.html" path='.' style=bartablestyle image_dpi=100;

ods graphics /reset imagename='BarTable' imagefmt=gif;
proc sgrender data=PGA2007 template=bartable;
run;

ods html close;
ods listing;
These sample files and code examples are provided by SAS Institute Inc. "as is" without warranty of any kind, either express or implied, including but not limited to the implied warranties of merchantability and fitness for a particular purpose. Recipients acknowledge and agree that SAS Institute shall not be liable for any damages whatsoever arising out of their use of this material. In addition, SAS Institute will provide no support for the materials contained herein.
This sample uses the Graph Template Language (GTL) to produce a bar chart with a data table below the graph.
| Type: | Sample |
| Topic: | SAS Reference ==> Procedures ==> SGRENDER Query and Reporting ==> Creating Reports ==> Graphical ==> Financial Industry Query and Reporting ==> Creating Reports ==> Graphical ==> Graph Template Language (GTL) |
| Date Modified: | 2009-03-19 09:41:17 |
| Date Created: | 2009-03-13 15:02:58 |
Operating System and Release Information
| Product Family | Product | Host | SAS Release | |
| Starting | Ending | |||
| SAS System | SAS/GRAPH | z/OS | 9.2 TS2M0 | |
| Microsoft® Windows® for 64-Bit Itanium-based Systems | 9.2 TS2M0 | |||
| Microsoft Windows Server 2003 Datacenter 64-bit Edition | 9.2 TS2M0 | |||
| Microsoft Windows Server 2003 Enterprise 64-bit Edition | 9.2 TS2M0 | |||
| Microsoft Windows XP 64-bit Edition | 9.2 TS2M0 | |||
| Microsoft® Windows® for x64 | 9.2 TS2M0 | |||
| Microsoft Windows Server 2003 Datacenter Edition | 9.2 TS2M0 | |||
| Microsoft Windows Server 2003 Enterprise Edition | 9.2 TS2M0 | |||
| Microsoft Windows Server 2003 Standard Edition | 9.2 TS2M0 | |||
| Microsoft Windows XP Professional | 9.2 TS2M0 | |||
| Windows Vista | 9.2 TS2M0 | |||
| 64-bit Enabled AIX | 9.2 TS2M0 | |||
| 64-bit Enabled HP-UX | 9.2 TS2M0 | |||
| 64-bit Enabled Solaris | 9.2 TS2M0 | |||
| HP-UX IPF | 9.2 TS2M0 | |||
| Linux | 9.2 TS2M0 | |||
| Linux for x64 | 9.2 TS2M0 | |||
| OpenVMS on HP Integrity | 9.2 TS2M0 | |||
| Solaris for x64 | 9.2 TS2M0 | |||