Sample 35129: Gridded Bar Chart with Error Bars
 |  |  |  |  |
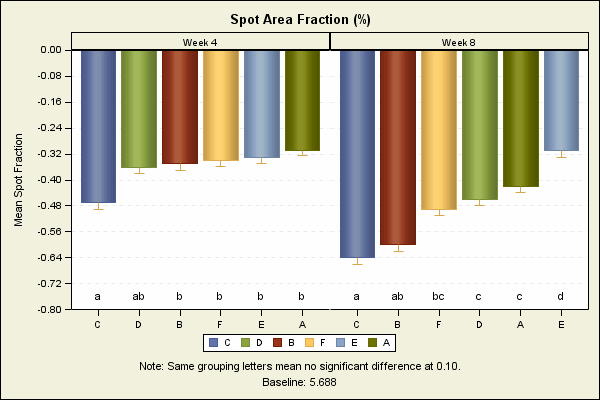
This sample uses the Graph Template Language (GTL) to produce two bar charts with error bars in a grid.
These sample files and code examples are provided by SAS Institute Inc. "as is" without warranty of any kind, either express or implied, including but not limited to the implied warranties of merchantability and fitness for a particular purpose. Recipients acknowledge and agree that SAS Institute shall not be liable for any damages whatsoever arising out of their use of this material. In addition, SAS Institute will provide no support for the materials contained herein.
This sample uses the Graph Template Language (GTL) to produce two bar charts with error bars in a grid.
data SpotArea;
  length group $2;
  input week $ 1-6 category $ _Mean1_spot_fraction_ _ERRORLOWER1_ group $ grouploc;
  cards;
Week 4 C -0.470 -0.48963 a  -0.76
Week 4 D -0.360 -0.37963 ab -0.76
Week 4 B -0.350 -0.36963 b  -0.76
Week 4 F -0.340 -0.35963 b  -0.76
Week 4 E -0.330 -0.34963 b  -0.76
Week 4 A -0.308 -0.32419 b  -0.76
Week 8 C -0.640 -0.65963 a  -0.76
Week 8 B -0.600 -0.61963 ab -0.76
Week 8 F -0.490 -0.50963 bc -0.76
Week 8 D -0.460 -0.47963 c  -0.76
Week 8 A -0.420 -0.43963 c  -0.76
Week 8 E -0.310 -0.32963 d  -0.76
;
run;

proc template;
define statgraph SpotArea;
begingraph /designwidth=600px designheight=400px;
EntryTitle "Spot Area Fraction (%)" /;
  layout gridded;
  layout datapanel classvars=( week) / sparse=false includeMissingClass=false
         headerLabelDisplay=Value rowDataRange=unionall columnDataRange=union
         start=TopLeft columns=2 rows=1
         rowAxisOpts=(griddisplay=on display=all altdisplay=all offsetmin=0
         offsetmax=0 type=auto label='Mean Spot Fraction'
         linearopts=(tickvaluelist=(0 -0.08 -0.16 -0.24 -0.32 -0.4 -0.48 -0.56 -0.64 -0.72 -0.8) viewmin=-0.8 viewmax=0))
         columnAxisOpts=(display=(ticks tickvalues line) altdisplay=(ticks tickvalues line) type=discrete);
  layout prototype / wallDisplay=(fill);
    ReferenceLine y=0;
    BarChartParm X=category Y=_Mean1_spot_fraction_ / primary=true  group=category
            LegendLabel="Spot Area Fraction (%), 95% Confidence Limits" NAME="VBAR" skin=modern;
    Scatterplot X=Category Y=_Mean1_spot_fraction_ / YErrorLower=_ERRORLOWER1_ markerattrs=(size=0);
    Scatterplot X=Category Y=grouploc / markercharacter=group markercharacterattrs=(size=8pt);
  endlayout;
  endlayout;
  discretelegend "VBAR";
  endlayout;
EntryFootnote "Note: Same grouping letters mean no significant difference at 0.10.";
EntryFootnote "Baseline: 5.688" ;
endgraph;
end;
run;

proc template;
  define Style SpotAreaStyle;
  parent = styles.harvest;
  style GraphFonts from GraphFonts
    "Fonts used in graph styles" /
      'GraphTitleFont' = (", ",10pt,bold)
      'GraphFootnoteFont' = (", ",8pt)
      'GraphLabelFont' = (", ",8pt)
      'GraphValueFont' = (", ",7pt)
      'GraphDataFont' = (", ",7pt);
  end;
run;

ods listing close;
ods html image_dpi=100 file="SpotArea.html" path='.' style=SpotAreaStyle;

ods graphics /reset imagename='SpotArea' imagefmt=gif;
proc sgrender data=SpotArea template=SpotArea;
run;

ods html close;
ods listing;
These sample files and code examples are provided by SAS Institute Inc. "as is" without warranty of any kind, either express or implied, including but not limited to the implied warranties of merchantability and fitness for a particular purpose. Recipients acknowledge and agree that SAS Institute shall not be liable for any damages whatsoever arising out of their use of this material. In addition, SAS Institute will provide no support for the materials contained herein.
This sample uses the Graph Template Language (GTL) to produce two bar charts with error bars in a grid.
| Type: | Sample |
| Topic: | SAS Reference ==> Procedures ==> SGRENDER Query and Reporting ==> Creating Reports ==> Graphical ==> Graph Template Language (GTL) |
| Date Modified: | 2009-03-19 09:33:06 |
| Date Created: | 2009-03-13 14:28:56 |
Operating System and Release Information
| Product Family | Product | Host | SAS Release | |
| Starting | Ending | |||
| SAS System | SAS/GRAPH | z/OS | 9.2 TS2M0 | |
| Microsoft® Windows® for 64-Bit Itanium-based Systems | 9.2 TS2M0 | |||
| Microsoft Windows Server 2003 Datacenter 64-bit Edition | 9.2 TS2M0 | |||
| Microsoft Windows Server 2003 Enterprise 64-bit Edition | 9.2 TS2M0 | |||
| Microsoft Windows XP 64-bit Edition | 9.2 TS2M0 | |||
| Microsoft® Windows® for x64 | 9.2 TS2M0 | |||
| Microsoft Windows Server 2003 Datacenter Edition | 9.2 TS2M0 | |||
| Microsoft Windows Server 2003 Enterprise Edition | 9.2 TS2M0 | |||
| Microsoft Windows Server 2003 Standard Edition | 9.2 TS2M0 | |||
| Microsoft Windows XP Professional | 9.2 TS2M0 | |||
| Windows Vista | 9.2 TS2M0 | |||
| 64-bit Enabled AIX | 9.2 TS2M0 | |||
| 64-bit Enabled HP-UX | 9.2 TS2M0 | |||
| 64-bit Enabled Solaris | 9.2 TS2M0 | |||
| HP-UX IPF | 9.2 TS2M0 | |||
| Linux | 9.2 TS2M0 | |||
| Linux for x64 | 9.2 TS2M0 | |||
| OpenVMS on HP Integrity | 9.2 TS2M0 | |||
| Solaris for x64 | 9.2 TS2M0 | |||