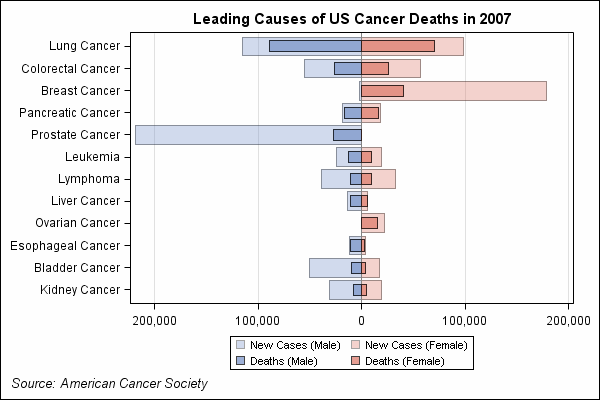
Sample 35051: Butterfly plot
 |  |  |  |  |
This sample uses the SGPLOT procedure to create a horizontal bar chart with overlay bars to represent different variables.
These sample files and code examples are provided by SAS Institute Inc. "as is" without warranty of any kind, either express or implied, including but not limited to the implied warranties of merchantability and fitness for a particular purpose. Recipients acknowledge and agree that SAS Institute shall not be liable for any damages whatsoever arising out of their use of this material. In addition, SAS Institute will provide no support for the materials contained herein.
This sample uses the SAS 9.2 SGPLOT procedure to create a horizontal bar chart with overlay bars to represent different variables.
data work.cancer;
   infile datalines;
   input cause $ 1-20 mcases fcases mdeaths fdeaths;
   deaths=mdeaths + fdeaths;
   mcases= -1 * mcases;
   mdeaths= -1 * mdeaths;
   datalines;
Lung Cancer         114760  98620  89510  70880
Colorectal Cancer    55290  57050  26000  26180
Breast Cancer         2030 178480    450  40460
Pancreatic Cancer    18830  18340  16840  16530
Prostate Cancer     218890      0  27050      0
Leukemia             24800  19440  12320   9470
Lymphoma             38670  32710  10370   9360
Liver Cancer         13650   5510  11280   5500
Ovarian Cancer           0  22430      0  15280
Esophageal Cancer    12130   3430  10900   3040
Bladder Cancer       50040  17120   9630   4120
Kidney Cancer        31590  19600   8080   4810
;
run;

proc sort data=cancer;
   by descending deaths;
run;

proc format;
   picture positive
     low-<0='000,000'
     0<-high='000,000';
run;

title 'Leading Causes of US Cancer Deaths in 2007';
footnote justify=left italic 'Source: American Cancer Society';

ods listing close;
ods html file='CancerDeaths' path='.';
ods graphics / reset width=600px height=400px imagename='Cancerdeaths' imagefmt=gif;

proc sgplot data=cancer;
   format mcases mdeaths fcases fdeaths positive.;
   hbar cause / response=mcases
        fillattrs=graphdata1 transparency=.65
        legendlabel="New Cases (Male)" name="mcases" ;
   hbar cause / response=mdeaths barwidth=.5
        fillattrs=graphdata1 transparency=.25
        legendlabel="Deaths (Male)" name="mdeaths" ;
   hbar cause / response=fcases
        fillattrs=graphdata2 transparency=.65
        legendlabel="New Cases (Female)" name="fcases";
   hbar cause / response=fdeaths barwidth=.5
        fillattrs=graphdata2 transparency=.25
        legendlabel="Deaths (Female)" name="fdeaths";
   keylegend "mcases" "fcases" "mdeaths" "fdeaths" / across=2;
   xaxis display=(nolabel) grid;
   yaxis display=(nolabel) discreteorder=data;
run;

ods html close;
ods listing;
These sample files and code examples are provided by SAS Institute Inc. "as is" without warranty of any kind, either express or implied, including but not limited to the implied warranties of merchantability and fitness for a particular purpose. Recipients acknowledge and agree that SAS Institute shall not be liable for any damages whatsoever arising out of their use of this material. In addition, SAS Institute will provide no support for the materials contained herein.
This sample uses the SGPLOT procedure to create a horizontal bar chart with overlay bars to represent different variables.
| Type: | Sample |
| Topic: | SAS Reference ==> Procedures ==> SGPLOT Query and Reporting ==> Creating Reports ==> Graphical ==> Health and Life Sciences Industry |
| Date Modified: | 2009-03-20 11:33:12 |
| Date Created: | 2009-03-06 10:13:28 |
Operating System and Release Information
| Product Family | Product | Host | SAS Release | |
| Starting | Ending | |||
| SAS System | SAS/GRAPH | z/OS | 9.2 TS1M0 | |
| Microsoft® Windows® for 64-Bit Itanium-based Systems | 9.2 TS1M0 | |||
| Microsoft Windows Server 2003 Datacenter 64-bit Edition | 9.2 TS1M0 | |||
| Microsoft Windows Server 2003 Enterprise 64-bit Edition | 9.2 TS1M0 | |||
| Microsoft Windows XP 64-bit Edition | 9.2 TS1M0 | |||
| Microsoft® Windows® for x64 | 9.2 TS1M0 | |||
| Microsoft Windows Server 2003 Datacenter Edition | 9.2 TS1M0 | |||
| Microsoft Windows Server 2003 Enterprise Edition | 9.2 TS1M0 | |||
| Microsoft Windows Server 2003 Standard Edition | 9.2 TS1M0 | |||
| Microsoft Windows XP Professional | 9.2 TS1M0 | |||
| Windows Vista | 9.2 TS1M0 | |||
| 64-bit Enabled AIX | 9.2 TS1M0 | |||
| 64-bit Enabled HP-UX | 9.2 TS1M0 | |||
| 64-bit Enabled Solaris | 9.2 TS1M0 | |||
| HP-UX IPF | 9.2 TS1M0 | |||
| Linux | 9.2 TS1M0 | |||
| Linux for x64 | 9.2 TS1M0 | |||
| OpenVMS on HP Integrity | 9.2 TS1M0 | |||
| Solaris for x64 | 9.2 TS1M0 | |||
