Usage Note 33056: Omitting whiskers or specifying whisker length in percentile units in PROC BOXPLOT
 |  |  |
Beginning in SAS 9.4 TS1M1, the WHISKERPERCENTILE=pctl option in the PLOT statement of PROC BOXPLOT specifies that the whiskers be drawn to the pctl and 1-pctl percentile values. Observations beyond these values are outliers. You can omit the whiskers by specifying WHISKERPERCENTILE=25.
Prior to SAS 9.4 TS1M1, PROC BOXPLOT has no option to draw the whiskers in percentile units, and there is no option to omit the whiskers altogether. The whisker lengths are determined by the BOXSTYLE= option in the PLOT statement. With BOXSTYLE=SCHEMATIC, the whiskers are drawn from the upper edge of the box to the largest observed value within the upper fence and from the lower edge of the box to the smallest observed value within the lower fence. The other whisker length available is BOXSTYLE=SKELETAL, which draws whiskers that extend out to the minimum and maximum data values.
The SYMBOL statement used with PROC GPLOT does have an interpolation option for specifying box plots with whiskers in percentile units, and allows the whiskers to be omitted. The examples below show basic and enhanced output from PROC GPLOT.
The following DATA step creates a test data set with some random data.
      data test;
        seed=238723;
        do group=1 to 3;
          do i=1 to 35;
            y=rannor(seed);
            output;
          end;
        end;
        drop i;
        run;
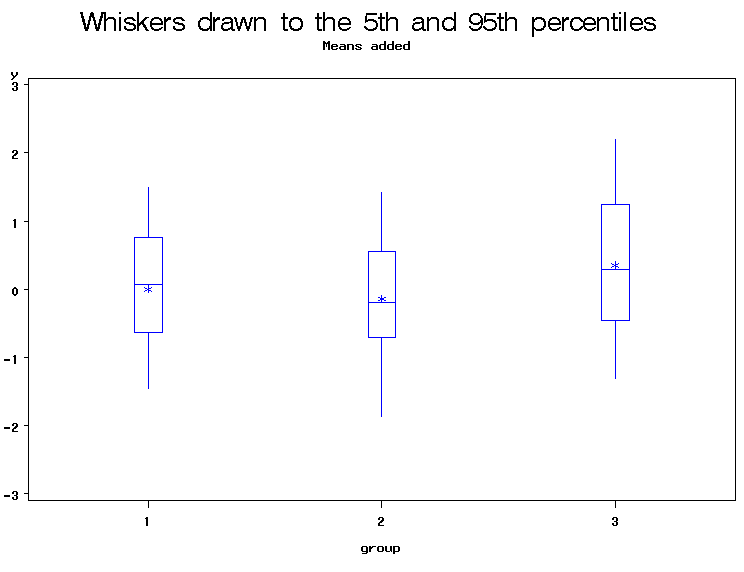
It is convenient to define macro variables containing the desired percentile values. In these examples, whiskers will be drawn down to the 5th percentile and up to the 95th percentile.
      %let nn=5;
      %let mm=95;
The I=BOXnn interpolation option in the SYMBOL statement produces box-and-whisker plots in PROC GPLOT. You can specify the two additional digits nn from 00 to 25 to control the whisker length in percentile units. For example, the I=BOX05 option draws whiskers to the 5th and 95th percentiles.
      symbol i=box&nn bwidth=5 c=blue;
      axis1 offset=(15,15) minor=none;
      axis2 minor=none;
      title "Whiskers drawn to the &nn.th and &mm.th percentiles";
      proc gplot data=test;
        plot y*group / haxis=axis1 vaxis=axis2;
        run;
        quit;

|
The means for each box-and-whisker plot are not displayed by PROC GPLOT, and prior to SAS 9.2, neither are the outliers. If desired, you can compute and overlay these value as follows. These statements compute the mean of each group.
      proc means data=test noprint;
        by group;
        var y;
        output out=out(drop=_type_ _freq_) mean=mean;
        run;
This DATA step adds the group means to each observation in the raw data set.
      data test;
        merge test out;
        by group;
        run;
These statements create a box plot with the means plotted for each group.
      symbol i=box&nn bwidth=5 c=blue;
      symbol2 v=star c=blue h=1;
      symbol3 v=dot c=red h=1;
      axis1 offset=(15,15) minor=none;
      axis2 minor=none;
      title2 h=1 "Means added";
      proc gplot data=test;
        plot y*group mean*group / overlay haxis=axis1 vaxis=axis2;
        run;
        quit;
|
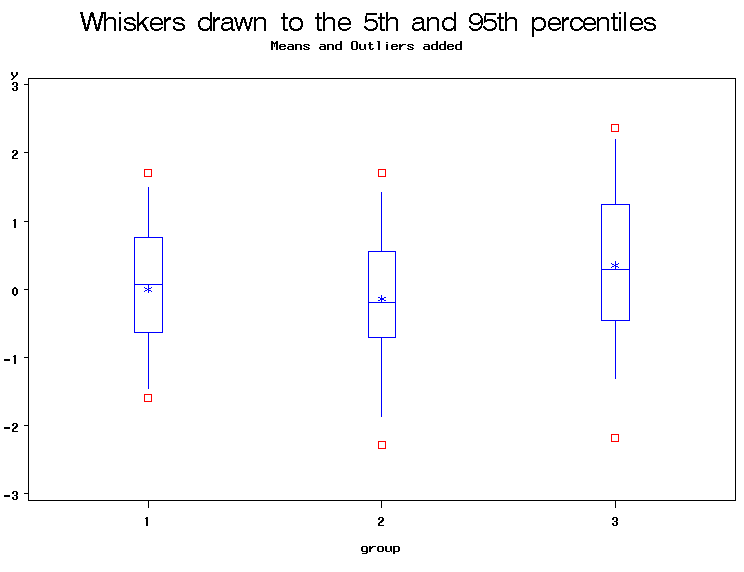
Similarly, you can compute and add the outliers to the plot.
      proc univariate data=test noprint;
        by group;
        var y;
        output out=out pctlpts=&nn &mm pctlpre=p;
        run;
      data test;
        merge test out;
        by group;
        if y<p&nn or y>p&mm then outlier=y;
        run;

      symbol i=box&nn bwidth=5 c=blue;
      symbol2 v=star c=blue h=1;
      symbol3 v=square c=red h=1;
      axis1 offset=(15,15) minor=none;
      axis2 minor=none;
      title2 h=1 'Means and Outliers added';
      proc gplot data=test;
        plot y*group mean*group outlier*group/ overlay haxis=axis1 vaxis=axis2;
        run;
        quit;
|
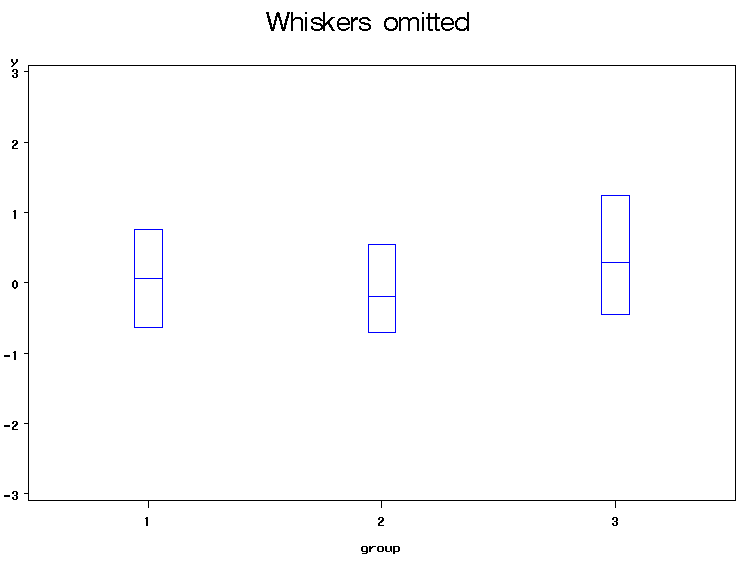
If you specify the I=BOX25 option in the SYMBOL statement, PROC GPLOT produces box plots with the whiskers omitted. The I=BOX25 option specifies that the whiskers be drawn to the 25th and 75th percentiles, which is equivalent to no whiskers.
      symbol i=box25 bwidth=5 c=blue;
      axis1 offset=(15,15) minor=none;
      axis2 minor=none;
      title "Whiskers omitted";
      proc gplot data=test;
        plot y*group / haxis=axis1 vaxis=axis2;
        run;
        quit;
 |
Operating System and Release Information
| Product Family | Product | System | SAS Release | |
| Reported | Fixed* | |||
| SAS System | SAS/STAT | Solaris | ||
| Linux | ||||
| Linux for x64 | ||||
| Linux on Itanium | ||||
| OpenVMS Alpha | ||||
| OpenVMS on HP Integrity | ||||
| Microsoft Windows XP Professional | ||||
| Windows Millennium Edition (Me) | ||||
| Windows Vista | ||||
| 64-bit Enabled AIX | ||||
| 64-bit Enabled HP-UX | ||||
| 64-bit Enabled Solaris | ||||
| ABI+ for Intel Architecture | ||||
| AIX | ||||
| HP-UX | ||||
| HP-UX IPF | ||||
| IRIX | ||||
| Microsoft Windows Server 2003 Standard Edition | ||||
| Microsoft Windows Server 2003 Enterprise Edition | ||||
| Microsoft Windows Server 2003 Datacenter Edition | ||||
| Microsoft Windows NT Workstation | ||||
| Microsoft Windows 2000 Professional | ||||
| Microsoft Windows 2000 Server | ||||
| Microsoft Windows 2000 Datacenter Server | ||||
| Microsoft Windows 2000 Advanced Server | ||||
| Microsoft Windows 95/98 | ||||
| OS/2 | ||||
| Microsoft® Windows® for x64 | ||||
| Microsoft Windows XP 64-bit Edition | ||||
| Microsoft Windows Server 2003 Enterprise 64-bit Edition | ||||
| Microsoft Windows Server 2003 Datacenter 64-bit Edition | ||||
| Microsoft® Windows® for 64-Bit Itanium-based Systems | ||||
| OpenVMS VAX | ||||
| z/OS | ||||
| Solaris for x64 | ||||
| Tru64 UNIX | ||||
| Type: | Usage Note |
| Priority: | |
| Topic: | SAS Reference ==> Procedures ==> BOXPLOT SAS Reference ==> Procedures ==> GPLOT Analytics ==> Distribution Analysis Analytics ==> Exploratory Data Analysis |
| Date Modified: | 2008-09-03 16:09:17 |
| Date Created: | 2008-08-25 15:39:23 |