Sample 26129: Create a dashboard with multiple dial meter indicators for use in a portlet
 |  |  |  |  |  |
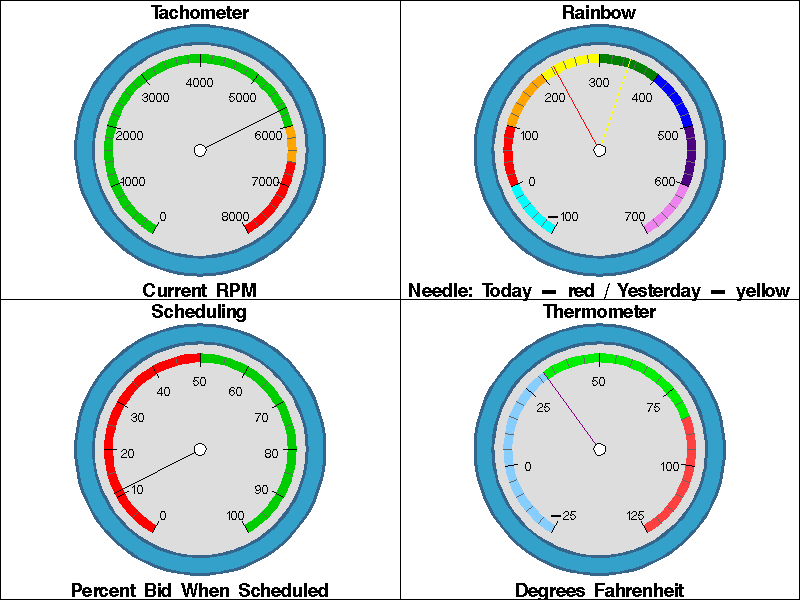
This sample uses the Annotate facility and the GANNO procedure in the SAS/GRAPH software to create a series of dial meter indicators, and then uses the GREPLAY procedure to arrange the indicators into a dashboard. This version is intended for use in the webDAV content portlet in SAS Information Delivery Portal software. For a sample of an individual indicator, see Create a dial meter indicator for use in a portlet.
The %DO_GAUGE macro is used to create different gauge charts of varying colors, ranges, and so on. For information on the %DO_GAUGE macro, see Create a dial meter indicator for use in a portlet. The dashboard in this sample is not necessarily a complete dashboard, but is a starting point to show you how to create custom gauges and how to insert them into a dashboard. Also, although gauges are commonly used in dashboards, other chart types might be more appropriate for displaying your data.
The %DO_GAUGE macro in this sample is enhanced to accept a new parameter that specifies the name of the GRSEG in which the gauge chart is stored temporarily. Here is the syntax of the enhanced %DO_GAUGE macro:
%macro do_gauge(mydata, major_tick_by, minor_tick_by, titletext, foottext, grseg_name);
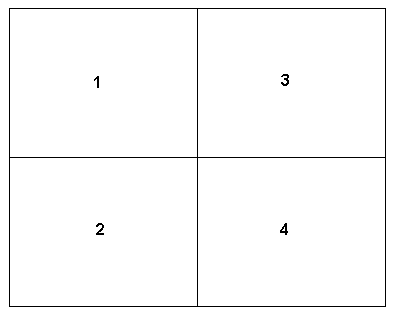
In this sample, the %DO_GAUGE macro is called four times, which stores four gauge charts in GRSEGs GAUGE1 through GAUGE4. It then uses the GREPLAY procedure with the l2r2 layout template to place the four gauges on the sample page. The l2r2 layout template is a standard template that ships with SAS. Here is the layout of the l2r2 template:

Here is the GREPLAY procedure TREPLAY action statement that draws the appropriate gauges into the desired areas of the l2r2 template:
   proc greplay tc=sashelp.templt nofs igout=work.gseg template=l2r2;
    treplay
    1:gauge1 3:gauge3
    2:gauge2 4:gauge4
    des='' name="&name";
   run;
Notice that GAUGE1 is replayed into area 1.
For additional information about creating dashboard applications with SAS/GRAPH software, see SAS/GRAPH Dashboard Samples.
These sample files and code examples are provided by SAS Institute Inc. "as is" without warranty of any kind, either express or implied, including but not limited to the implied warranties of merchantability and fitness for a particular purpose. Recipients acknowledge and agree that SAS Institute shall not be liable for any damages whatsoever arising out of their use of this material. In addition, SAS Institute will provide no support for the materials contained herein.
%let name=dialMeterDashPortal;
filename odsout '.';

/*
This is a custom gauge chart, created using good-old
traditional sas/graph technology - namely annotated
'pies', lines and text.

The gauge is created by specifying the values for
the start-angle and end-angle and color, for each
colored range/segment (you specify these as the
'segment's observations in data data set below),
and also an observation in the dataset for the
'arrow' (this is the pointer/arrow for the gauge).
*/

goptions reset=all;
goptions device=gif;

%let ftitle='swissb';
%let ftext='swissl';

%let backcolor=white;

%let label_color=black;

%let outer_ring_color=cx33A1C9;
%let inner_border_color=cx36648B;
%let outer_border_color=cx36648B;
%let gray_color=cxdddddd;
%let hub_color=white;
%let hub_border=black;

%let minor_tick_color=gray66;
%let major_tick_color=black;

/* If you don't have access to the external web, you'll need to put this
   html file somewhere you have access to, and change the url below to
   your valid location.
*/
%let hardcoded_drilldown=http://support.sas.com/rnd/datavisualization/dashboards/generic_drilldown.htm;


/**************************************************************************/
/* The do_gauge macro creates an individual dial meter indicator. The dial
meter is created by specifying the values for the start-angle, end-angle,
and color for each segment, along with a value to specify the position of
the pointer for the gauge.

The do_gauge macro accepts the following list of parameters:

mydata = name of the data set that contains indicator values
major_tick_by = increment for major tick marks
minor_tick_by = increment for minor tick marks
titletext = title to print above individual chart
foottext = title to print below individual chart
pltname = name of GRSEG to store the chart
*/

%macro do_gauge(mydata, major_tick_by, minor_tick_by, titletext, foottext, pltname);

%local mydata major_tick_by minor_tick_by titletext foottext pltname;

proc sql noprint;
   select min(start) into :min_start from &mydata where (lowcase(grtype) eq 'segment');
   select max(end)   into :max_end from   &mydata where (lowcase(grtype) eq 'segment');
   select min(start) into :arrow_val from &mydata where (lowcase(grtype) eq 'arrow');
quit;

data ranges arrow text;
   length html $500;
   length text $100;
   length function color $ 8;
   length style $ 20;
   set &mydata;
   xsys='3'; ysys='3'; hsys='3'; when='A';

   /* Draw color range segments */
   if grtype eq 'segment' then do;
      x=50; y=50; size=32;
      function='PIE';
      style='PSOLID';
      min_start=&min_start;
      max_end=&max_end;
      percent_start=((start-&min_start)/(&max_end-&min_start));
      percent_end=((end-&min_start)/(&max_end-&min_start));
      angle_start=240-((start-&min_start)/(&max_end-&min_start))*300;
      angle_end=240-((end-&min_start)/(&max_end-&min_start))*300;
      angle=angle_end;
      rotate=
      (240-((start-&min_start)/(&max_end-&min_start))*300)
      -
      (240-((end-&min_start)/(&max_end-&min_start))*300)
      ;
      output ranges;
   end;

   /* Draw an arrow pointer by first drawing a fake pie slice, then
      positioning the cursor at 100% to the edge of this invisible slice,
      then drawing a line back to the center of the chart (coordinate 50,50). */
   else if grtype eq 'arrow' then do;
      x=50; y=50; size=32;
      function='PIE'; when='b'; style='PSOLID';  /* real pie slice is invisible/behind */
      angle=240-((start-&min_start)/(&max_end-&min_start))*300;
      rotate=.1;
      output arrow;
      function='piexy'; size=1; /* With piexy size is the 'multiplier' for the previous pie's size */
      output arrow;
      x=50; y=50; when='a'; function='draw'; size=.5;  /* size is width of line now */
      output arrow;

      /* Add text labels at the bottom and top of the pie (in conjunction with
         drawing the arrow, so it is done only once. */
      function='label'; color="&label_color";
      style="&ftitle";
      angle=0; rotate=0;
      position='5'; size=6;
      y=98; text="&titletext";
      output text;
      y=5;  text="&foottext";
      output text;
   end;
run;


/* The dial meter has several different color bands and borders.
   This is done by overlapping several pies. */
data behind middle front hub;
   length function color $ 8;
   length style $ 20;
   xsys='3'; ysys='3'; hsys='3'; when='A';

   /* Position the center of the gauge in the center of the page. */
   x=50; y=50;

   /* Set the 'tool tip' for the chart to provide a link to an
      HTML page with drill-down details. */
   length html $ 200;
   html='title='||quote( trim(left("&arrow_val"))) ||' '||
   'href="'||"&hardcoded_drilldown"||'"';

   function='PIE'; style='PSOLID';
   angle=0;
   rotate=360;
   color="&outer_border_color"; size=42; output behind;  /* outer border */

   /* Ensure that the tool tip appears only for the outer/biggest pie slice. */
   html='';

   color="&outer_ring_color"; size=41; output behind;    /* outer color swatch/ring */
   color="&inner_border_color"; size=36; output behind;  /* inner color border */
   color="&gray_color"; size=35; output behind;          /* gray area */
   color="&gray_color"; size=29; output middle;          /* gray area, inside colored ranges */
   color="&gray_color"; size=27.5; output front;         /* innermost gray area (chops the major tickmarks) */
   color="&hub_color";  size=2; output hub;              /* white center */
   color="&hub_border"; size=2; style="pempty"; output hub; /* black ring around white center */
run;

/* Draw the minor tick marks.  The process is similar to drawing the
   arrow/pointer line, except that ticks overlap a smaller gray pie on
   top of them so you don't see the whole line, but only the piece of the
   line in the "tick" area. */
data minorticks;
   length text $100;
   length function color $ 8;
   length style $ 20;
   xsys='3'; ysys='3'; hsys='3';
   do tick = &min_start to &max_end by &minor_tick_by;
      x=50; y=50; size=32;
      function='PIE'; when='b'; style='pempty';  /* real pie slice is invisible/behind */
      angle=240-((tick-&min_start)/(&max_end-&min_start))*300;
      rotate=.1;
      output;
      function='piexy'; size=1;
      output;
      x=50; y=50; color="&minor_tick_color"; when='a'; function='draw'; size=.1;
      output;
   end;
run;

/* Major ticks marks are done in the same way as the minor ticks. */
data majorticks;
   length text $100;
   length function color $ 8;
   length style $ 20;
   xsys='3'; ysys='3'; hsys='3';
   do tick = &min_start to &max_end by &major_tick_by;
      x=50; y=50; size=32;
      function='PIE'; when='b'; style='pempty';  /* real pie slice is invisible/behind */
      angle=240-((tick-&min_start)/(&max_end-&min_start))*300;
      rotate=.1;
      output;
      function='piexy'; size=1;
      output;
      x=50; y=50; color="&major_tick_color"; when='a'; function='draw'; size=.1;  output;
   end;
run;

data majornums;
   length text $100;
   length function color $ 8;
   length style $ 20;
   xsys='3'; ysys='3'; hsys='3';
   do tick = &min_start to &max_end by &major_tick_by;
      x=50; y=50; size=32;
      function='PIE'; when='b'; style='pempty';  /* real pie slice is invisible/behind */
      angle=240-((tick-&min_start)/(&max_end-&min_start))*300;
      rotate=.1;
      output;
      function='piexy'; size=.75;
      output;
      function='cntl2txt';
      output;
      function='label'; when='a'; text=trim(left(tick)); angle=0; rotate=0;
      position='5'; style="&ftext"; size=4.25; x=.; y=.;
      output;
   end;
run;

data gaugeanno;
   set behind ranges minorticks middle majorticks front majornums arrow hub text;
run;

proc ganno annotate=gaugeanno des="" name="&pltname";
run;
quit;

%mend do_gauge;

/**************************************************************************/

/* Delete all GRSEGs in the current session to ensure that indicators use
the expected names.  If a name is already in use, then an attempt to create
a new GRSEG using that name it will add a number to the name.  In that case,
the subsequent GREPLAY will be placing the wrong GRSEGs into the dashboard.

Note: The macro code just checks whether there are any gsegs to delete.  If
it tried to delete specific entries and none existed, then you would get an
error message: "ERROR: Member-name GSEG is unknown." */

%macro delcat(catname);
 %if %sysfunc(cexist(&catname)) %then %do;
  proc greplay nofs igout=&catname;
  delete _all_;
  run;
 %end;
 quit;
%mend delcat;

%delcat(work.gseg);

/*******************************************************************************/

goptions device=gif;
goptions xpixels=400 ypixels=300;
options mprint;

data my_data1;
   length grtype color $ 8;
   input  grtype color start end;
   cards;
segment cx00cd00    0 6000
segment orange   6000 6600
segment cxff0000 6600 8000
arrow   black    5700 .
;
run;

data my_data2;
   length grtype color $ 8;
   input  grtype color start end;
   cards;
segment cxff0000  0  50
segment cx00cd00 50 100
arrow   black     11 .
;
run;

data my_data3;
   length grtype color $ 8;
   input  grtype color start end;
   cards;
segment cyan     -100    0
segment red         0  100
segment orange    100  200
segment yellow    200  300
segment green     300  400
segment blue      400  500
segment indigo    500  600
segment violet    600  700
arrow   red       223  .
arrow   yellow    350  .
;
run;

data my_data4;
   length grtype color $ 8;
   input  grtype color start end;
   cards;
segment cx87CEFF -25  32
segment cx00EE00  32  85
segment cxFF4040  85 125
arrow   purple    32  .
;
run;

/* Run the do_gauge macro for each chart, passing in the name of
the data set and the name of the GRSEG to store the output in. */

goptions nodisplay;
%do_gauge(my_data1,1000,200,Tachometer,Current RPM,gauge1);
%do_gauge(my_data2,10,5,Scheduling,Percent Bid When Scheduled,gauge2);
%do_gauge(my_data3,100,20,Rainbow,Needle: Today - red / Yesterday - yellow,gauge3);
%do_gauge(my_data4,25,5,Thermometer,Degrees Fahrenheit,gauge4);


/* Create the dashboard from the individual indicators. */
goptions display;
goptions xpixels=800 ypixels=600;
goptions cback=&backcolor;
goptions noborder;

ODS LISTING CLOSE;
ODS HTML path=odsout body="&name..htm" (title="Custom Gauge Dashboard" no_top_matter no_bottom_matter)
   style=minimal;

/* This example uses a template supplied with SAS/GRAPH software that has
   space for two charts on the left and two charts on the right. */
proc greplay tc=sashelp.templt nofs igout=work.gseg template=l2r2;
   treplay
      1:gauge1 3:gauge3
      2:gauge2 4:gauge4
      des=""
      name="&name";
run;
quit;

ODS HTML CLOSE;
ODS LISTING;
These sample files and code examples are provided by SAS Institute Inc. "as is" without warranty of any kind, either express or implied, including but not limited to the implied warranties of merchantability and fitness for a particular purpose. Recipients acknowledge and agree that SAS Institute shall not be liable for any damages whatsoever arising out of their use of this material. In addition, SAS Institute will provide no support for the materials contained herein.

dialMeterDashPortal.sas
The following file contains SAS macro code to add the directory that contains the portlet version of the samples to a WebDAV repository. To download a copy, click on the link and select the Save option.
copyToWebDAV.sas
Note: Requires Service Pack 4 for SAS 9.1.3. See Service Packs for the SAS9 Platform.
| Type: | Sample |
| Topic: | Query and Reporting ==> Creating Reports ==> Graphical ==> Graph Types ==> Dashboards |
| Date Modified: | 2009-01-07 14:38:43 |
| Date Created: | 2006-12-23 03:03:04 |
Operating System and Release Information
| Product Family | Product | Host | SAS Release | |
| Starting | Ending | |||
| SAS System | SAS/GRAPH | All | 9.1 TS1M3 | 9.1 TS1M3 |