Sample 25583: Plotting two variables using the PLOT statement with PROC GPLOT
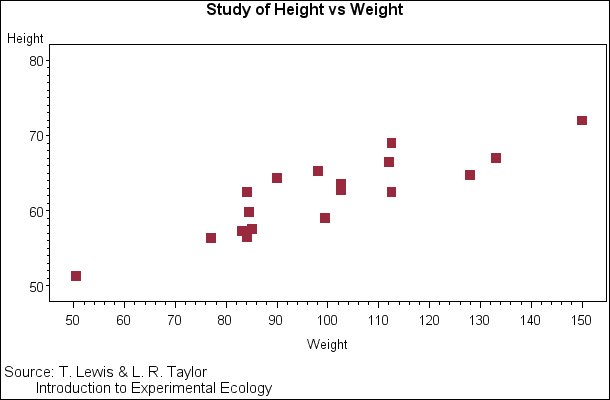
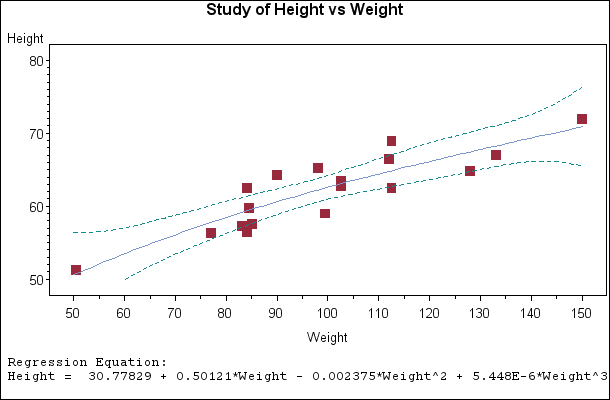
This sample uses the PLOT statement with PROC GPLOT to create two graphs. The first PLOT statement plots the variable HEIGHT against the variable WEIGHT, while the second PLOT statement plots a regression analysis with confidence limits.
These sample files and code examples are provided by SAS Institute
Inc. "as is" without warranty of any kind, either express or implied, including
but not limited to the implied warranties of merchantability and fitness for a
particular purpose. Recipients acknowledge and agree that SAS Institute shall
not be liable for any damages whatsoever arising out of their use of this material.
In addition, SAS Institute will provide no support for the materials contained herein.
This sample uses the PLOT statement with PROC GPLOT to create two graphs. The first PLOT statement plots the variable HEIGHT against the variable WEIGHT, while the second PLOT statement plots a regression analysis with confidence limits.
The graphics output in the Results tab was produced using SAS® 9.2. Submitting the sample code with releases of SAS prior to SAS 9.2 might produce different results.
 /* Set the graphics environment */
goptions reset=all cback=white border htitle=12pt htext=10pt;

 /* Create the data set STATS */
data stats;
   input Height Weight;
   datalines;
69.0  112.5
56.5   84.0
65.3   98.0
62.8  102.5
63.5  102.5
57.3   83.0
59.8   84.5
62.5  112.5
62.5   84.0
59.0   99.5
51.3   50.5
64.3   90.0
56.3   77.0
66.5  112.0
72.0  150.0
64.8  128.0
67.0  133.0
57.5   85.0
;
run;

 /* Define title and footnotes */
title1 'Study of Height vs Weight';
footnote1 h=11pt j=l ' Source: T. Lewis & L. R. Taylor';
footnote2 h=11pt j=l '         Introduction to Experimental Ecology';
footnote3 h=.5 '  ';

symbol1 font=marker value=U height=1.1 color=depk;

axis1 offset=(4pct,4pct);

 /* Generate the scatter plot */
proc gplot data= stats;
   plot height*weight / vaxis=axis1 haxis=axis1;
run;

footnote1 '  ';

 /* Define symbol characteristics for second graph */
symbol1 interpol=rcclm95 /* regression analysis with */
                         /* confidence limits        */
        font=marker
        value=U          /* plot symbol              */
        height=1.1       /* plot symbol height       */
        cv=depk          /* plot symbol color        */
        ci=CX7C95CA      /* regression line color    */
        co=vibg          /* confidence limits color  */
        width=1;         /* line width               */

      /* Generate scatter plot with regression */
   plot height*weight / haxis=axis1
                        vaxis=axis1
                        hminor=1
                        regeqn;
run;
quit;
These sample files and code examples are provided by SAS Institute
Inc. "as is" without warranty of any kind, either express or implied, including
but not limited to the implied warranties of merchantability and fitness for a
particular purpose. Recipients acknowledge and agree that SAS Institute shall
not be liable for any damages whatsoever arising out of their use of this material.
In addition, SAS Institute will provide no support for the materials contained herein.
This sample uses the PLOT statement with PROC GPLOT to create two graphs. The first PLOT statement plots the variable HEIGHT against the variable WEIGHT, while the second PLOT statement plots a regression analysis with confidence limits.
| Type: | Sample |
| Topic: | SAS Reference ==> Procedures ==> GPLOT
|
| Date Modified: | 2005-09-01 03:03:11 |
| Date Created: | 2005-05-23 14:17:04 |
Operating System and Release Information
| SAS System | SAS/GRAPH | z/OS | 9.1 TS1M0 | |
| Microsoft® Windows® for 64-Bit Itanium-based Systems | 9.1 TS1M0 | |
| Microsoft Windows Server 2003 Datacenter 64-bit Edition | 9.1 TS1M0 | |
| Microsoft Windows Server 2003 Enterprise 64-bit Edition | 9.1 TS1M0 | |
| Microsoft Windows 2000 Advanced Server | 9.1 TS1M0 | |
| Microsoft Windows 2000 Datacenter Server | 9.1 TS1M0 | |
| Microsoft Windows 2000 Server | 9.1 TS1M0 | |
| Microsoft Windows 2000 Professional | 9.1 TS1M0 | |
| Microsoft Windows NT Workstation | 9.1 TS1M0 | |
| Microsoft Windows Server 2003 Datacenter Edition | 9.1 TS1M0 | |
| Microsoft Windows Server 2003 Enterprise Edition | 9.1 TS1M0 | |
| Microsoft Windows Server 2003 Standard Edition | 9.1 TS1M0 | |
| Microsoft Windows XP Professional | 9.1 TS1M0 | |
| 64-bit Enabled AIX | 9.1 TS1M0 | |
| 64-bit Enabled HP-UX | 9.1 TS1M0 | |
| 64-bit Enabled Solaris | 9.1 TS1M0 | |
| HP-UX IPF | 9.1 TS1M0 | |
| Linux | 9.1 TS1M0 | |
| OpenVMS Alpha | 9.1 TS1M0 | |
| Tru64 UNIX | 9.1 TS1M0 | |


