Sample 25582: Plotting with different scales of values using PROC GPLOT
 |  |  |  |  |
This sample demonstrates how to use a PLOT2 statement with PROC GPLOT. This sample code generates a right vertical axis that displays the values of the vertical coordinates in a different scale from the scale that is used for the left vertical axis.
These sample files and code examples are provided by SAS Institute Inc. "as is" without warranty of any kind, either express or implied, including but not limited to the implied warranties of merchantability and fitness for a particular purpose. Recipients acknowledge and agree that SAS Institute shall not be liable for any damages whatsoever arising out of their use of this material. In addition, SAS Institute will provide no support for the materials contained herein.
This sample demonstrates how to use a PLOT2 statement with PROC GPLOT. This sample code generates a right vertical axis that displays the values of the vertical coordinates in a different scale from the scale that is used for the left vertical axis.
/* Set the graphics environment */
goptions reset=all border cback=white htitle=12pt htext=10pt;

/* Create the data set MINNTEMP */
data minntemp;
   input month
         f2;  /* Fahrenheit temperature for Minneapolis */
   /* Calculate Centigrade temperature */
   /* for Minneapolis                  */
   c2=(f2-32)/1.8;
   datalines;
1    12.2
2    16.5
3    28.3
4    45.1
5    57.1
6    66.9
7    71.9
8    70.2
9    60.0
10   50.0
11   32.4
12   18.6
;
run;

/* Define the title */
title1 'Average Monthly Temp for Minneapolis';
footnote1 ' ';

/* Define symbol characteristics */
symbol1 interpol=needle ci=mob cv=red value=star
        height=2 width=4;
symbol2 interpol=none value=none;

/* Define axis characteristics */
axis1 label=none
      value=('Jan' 'Feb' 'Mar' 'Apr' 'May' 'Jun'
             'Jul' 'Aug' 'Sep' 'Oct' 'Nov' 'Dec')
      order=(1 to 12 by 1)
      offset=(2)
      width=1
      minor=none;
axis2 label=('Degrees' justify=right ' Centigrade')
      order=(-20 to 30 by 10)
      minor=(n=1);
axis3 label=('Degrees' justify=left 'Fahrenheit')
      order=(-4 to 86 by 18)
      minor=(n=1);

/* Generate a plot with a second vertical axis */
proc gplot data= minntemp;
   plot c2*month / frame
                   haxis=axis1
                   vaxis=axis2;
   plot2 f2*month / vaxis=axis3;
run;
quit;
These sample files and code examples are provided by SAS Institute Inc. "as is" without warranty of any kind, either express or implied, including but not limited to the implied warranties of merchantability and fitness for a particular purpose. Recipients acknowledge and agree that SAS Institute shall not be liable for any damages whatsoever arising out of their use of this material. In addition, SAS Institute will provide no support for the materials contained herein.
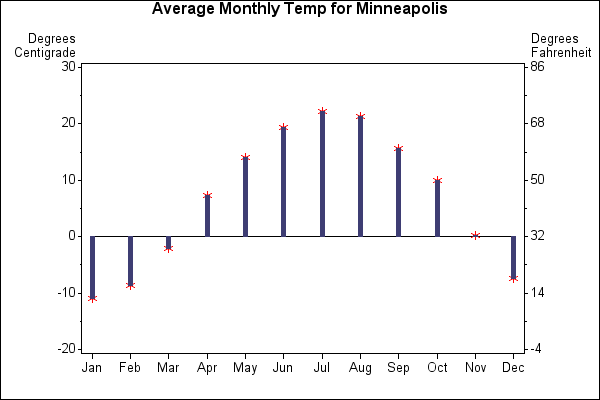
This example shows how a PLOT2 statement generates a right vertical axis that displays the values of the vertical coordinates in a different scale from the scale that is used for the left vertical axis.
| Type: | Sample |
| Topic: | SAS Reference ==> Procedures ==> GPLOT Query and Reporting ==> Creating Reports ==> Graphical ==> Graph Types ==> Plots ==> Other Plots |
| Date Modified: | 2005-08-27 03:03:27 |
| Date Created: | 2005-05-23 14:17:00 |
Operating System and Release Information
| Product Family | Product | Host | SAS Release | |
| Starting | Ending | |||
| SAS System | SAS/GRAPH | z/OS | 9.1 TS1M0 | |
| Microsoft® Windows® for 64-Bit Itanium-based Systems | 9.1 TS1M0 | |||
| Microsoft Windows Server 2003 Datacenter 64-bit Edition | 9.1 TS1M0 | |||
| Microsoft Windows Server 2003 Enterprise 64-bit Edition | 9.1 TS1M0 | |||
| Microsoft Windows 2000 Advanced Server | 9.1 TS1M0 | |||
| Microsoft Windows 2000 Datacenter Server | 9.1 TS1M0 | |||
| Microsoft Windows 2000 Server | 9.1 TS1M0 | |||
| Microsoft Windows 2000 Professional | 9.1 TS1M0 | |||
| Microsoft Windows NT Workstation | 9.1 TS1M0 | |||
| Microsoft Windows Server 2003 Datacenter Edition | 9.1 TS1M0 | |||
| Microsoft Windows Server 2003 Enterprise Edition | 9.1 TS1M0 | |||
| Microsoft Windows Server 2003 Standard Edition | 9.1 TS1M0 | |||
| Microsoft Windows XP Professional | 9.1 TS1M0 | |||
| 64-bit Enabled AIX | 9.1 TS1M0 | |||
| 64-bit Enabled HP-UX | 9.1 TS1M0 | |||
| 64-bit Enabled Solaris | 9.1 TS1M0 | |||
| HP-UX IPF | 9.1 TS1M0 | |||
| Linux | 9.1 TS1M0 | |||
| OpenVMS Alpha | 9.1 TS1M0 | |||
| Tru64 UNIX | 9.1 TS1M0 | |||