Sample 25575: Add a right vertical axis to a plot using PROC GPLOT
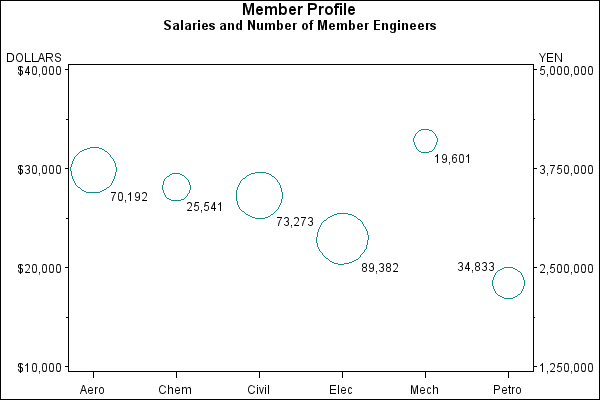
This example illustrates how a BUBBLE2 statement with PROC GPLOT generates a right vertical axis that displays the values of the vertical coordinates in a different scale than the scale that is used for the left vertical axis.
These sample files and code examples are provided by SAS Institute
Inc. "as is" without warranty of any kind, either express or implied, including
but not limited to the implied warranties of merchantability and fitness for a
particular purpose. Recipients acknowledge and agree that SAS Institute shall
not be liable for any damages whatsoever arising out of their use of this material.
In addition, SAS Institute will provide no support for the materials contained herein.
This sample code illustrates how a BUBBLE2 statement with PROC GPLOT generates a right vertical axis that displays the values of the vertical coordinates in a different scale than the scale that is used for the left vertical axis.
The graphics output in the Results tab was produced using SAS® 9.2. Submitting the sample code with releases of SAS prior to SAS 9.2 might produce different results.
 /* Set the graphics environment */
goptions reset=all border cback=white htitle=12pt htext=9pt;

 /* Create the data set JOBS */
data jobs;
   length eng $5;
   input ENG DOLLARS NUM;
   datalines;
Civil 27308 73273
Aero  29844 70192
Elec  22920 89382
Mech  32816 19601
Chem  28116 25541
Petro 18444 34833
;
run;

 /* Create the data set JOBS2. */
 /* Calculate variable YEN.   */
data jobs2;
   set jobs;
   yen=dollars*125;
run;

 /* Define titles */
title1 'Member Profile';
title2 h=10pt 'Salaries and Number of Member Engineers';

 /* Define horizontal-axis characteristics */
axis1 offset=(5,5) label=none;

 /* Generate the bubble plot with a second vertical axis */
proc gplot data= jobs2;
   format dollars dollar7. num yen comma9.0;
   bubble dollars*eng=num / haxis=axis1
                            vaxis=10000 to 40000 by 10000
                            hminor=0
                            vminor=1
                            blabel
                            bcolor=vibg
                            bsize=12;

   bubble2 yen*eng=num / vaxis=1250000 to 5000000 by 1250000
                         vminor=1
                         bcolor=vibg
                         bsize=12;
run;
quit;
These sample files and code examples are provided by SAS Institute
Inc. "as is" without warranty of any kind, either express or implied, including
but not limited to the implied warranties of merchantability and fitness for a
particular purpose. Recipients acknowledge and agree that SAS Institute shall
not be liable for any damages whatsoever arising out of their use of this material.
In addition, SAS Institute will provide no support for the materials contained herein.
This example illustrates how a BUBBLE2 statement with PROC GPLOT generates a right vertical axis that displays the values of the vertical coordinates in a different scale than the scale that is used for the left vertical axis.
| Type: | Sample |
| Topic: | Query and Reporting ==> Creating Reports ==> Graphical ==> Graph Types ==> Plots ==> Bubble
SAS Reference ==> Procedures ==> GPLOT
|
| Date Modified: | 2005-08-27 03:03:26 |
| Date Created: | 2005-05-23 14:16:33 |
Operating System and Release Information
| SAS System | SAS/GRAPH | z/OS | 9.1 TS1M0 | |
| Microsoft® Windows® for 64-Bit Itanium-based Systems | 9.1 TS1M0 | |
| Microsoft Windows Server 2003 Datacenter 64-bit Edition | 9.1 TS1M0 | |
| Microsoft Windows Server 2003 Enterprise 64-bit Edition | 9.1 TS1M0 | |
| Microsoft Windows 2000 Advanced Server | 9.1 TS1M0 | |
| Microsoft Windows 2000 Datacenter Server | 9.1 TS1M0 | |
| Microsoft Windows 2000 Server | 9.1 TS1M0 | |
| Microsoft Windows 2000 Professional | 9.1 TS1M0 | |
| Microsoft Windows NT Workstation | 9.1 TS1M0 | |
| Microsoft Windows Server 2003 Datacenter Edition | 9.1 TS1M0 | |
| Microsoft Windows Server 2003 Enterprise Edition | 9.1 TS1M0 | |
| Microsoft Windows Server 2003 Standard Edition | 9.1 TS1M0 | |
| Microsoft Windows XP Professional | 9.1 TS1M0 | |
| 64-bit Enabled AIX | 9.1 TS1M0 | |
| 64-bit Enabled HP-UX | 9.1 TS1M0 | |
| 64-bit Enabled Solaris | 9.1 TS1M0 | |
| HP-UX IPF | 9.1 TS1M0 | |
| Linux | 9.1 TS1M0 | |
| OpenVMS Alpha | 9.1 TS1M0 | |
| Tru64 UNIX | 9.1 TS1M0 | |


