Sample 25559: Specify response levels in a block map using PROC GMAP
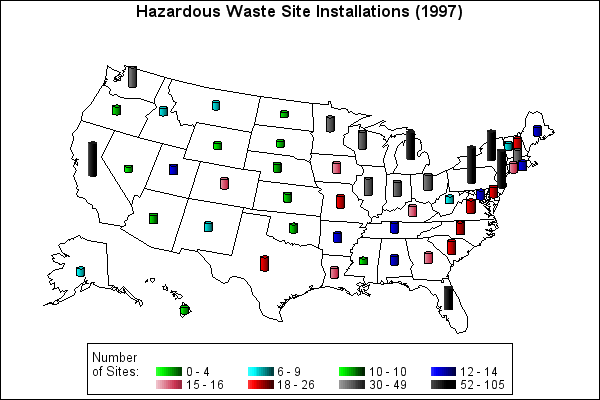
This example uses the LEVELS= option on the BLOCK statement with PROC GMAP to specify the number of response levels for the blocks. Eight PATTERN statements explicitly define a color for each of these response levels.
These sample files and code examples are provided by SAS Institute
Inc. "as is" without warranty of any kind, either express or implied, including
but not limited to the implied warranties of merchantability and fitness for a
particular purpose. Recipients acknowledge and agree that SAS Institute shall
not be liable for any damages whatsoever arising out of their use of this material.
In addition, SAS Institute will provide no support for the materials contained herein.
This example uses the LEVELS= option on the BLOCK statement with PROC GMAP to specify the number of response levels for the blocks. Eight PATTERN statements explicitly define a color for each of these response levels.
The graphics output in the Results tab was produced using SAS® 9.2. Submitting the sample code with releases of SAS prior to SAS 9.2 might produce different results.
 /* Define the libref of MAPS if necessary */
*libname maps 'SAS-MAPS-library';

 /* Set the graphics environment */
goptions reset=all border cback=white htitle=13pt;

 /* Create the SITES data set */
data sites;
   length stcode $ 2;
   input region stcode $ sites;
   state=stfips(stcode);
   datalines;
6   AR  12
10  AK  7
4   AL  12
9   AZ  10
9   CA  90
8   CO  15
1   CT  15
3   DE  18
4   FL  52
4   GA  15
9   HI  4
7   IA  16
10  ID  8
5   IL  38
5   IN  30
7   KS  10
4   KY  16
6   LA  15
1   MA  30
3   MD  13
1   ME  12
5   MI  72
5   MN  30
7   MO  22
4   MS  1
8   MT  8
4   NC  22
8   ND  0
7   NE  10
1   NH  18
2   NJ  105
6   NM  9
9   NV  1
2   NY  78
5   OH  34
6   OK  10
10  OR  10
3   PA  100
1   RI  12
4   SC  26
8   SD  2
4   TN  14
6   TX  26
8   UT  12
3   VA  25
1   VT  8
10  WA  49
5   WI  40
3   WV  6
8   WY  3
;
run;

 /* Define a title for the map */
title1 'Hazardous Waste Site Installations (1997)';

 /* Define pattern colors for blocks */
pattern1 value=solid color=lime;
pattern2 value=solid color=cyan;
pattern3 value=solid color=green;
pattern4 value=solid color=blue;
pattern5 value=solid color=lipk;
pattern6 value=solid color=red;
pattern7 value=solid color=gray;
pattern8 value=solid color=black;

 /* Define pattern for map areas */
pattern9 value=mempty color=black repeat=50;

 /* Define legend characteristics */
legend1 value=(j=l) label=('Number' j=l 'of Sites:')
          frame;

 /* Display the block map */
proc gmap map=maps.us data=sites;
   id state;
   block sites / shape=cylinder
                 legend=legend1
                 levels=8
                 xview=0.75
                 zview=5;
run;
quit;
These sample files and code examples are provided by SAS Institute
Inc. "as is" without warranty of any kind, either express or implied, including
but not limited to the implied warranties of merchantability and fitness for a
particular purpose. Recipients acknowledge and agree that SAS Institute shall
not be liable for any damages whatsoever arising out of their use of this material.
In addition, SAS Institute will provide no support for the materials contained herein.
This example uses the LEVELS= option on the BLOCK statement with PROC GMAP to specify the number of response levels for the blocks. Eight PATTERN statements explicitly define a color for each of these response levels.
| Type: | Sample |
| Topic: | SAS Reference ==> Procedures ==> GMAP
Query and Reporting ==> Creating Reports ==> Graphical ==> Graph Types ==> Maps ==> Other Maps
|
| Date Modified: | 2005-08-27 03:03:23 |
| Date Created: | 2005-05-23 14:15:31 |
Operating System and Release Information
| SAS System | SAS/GRAPH | z/OS | 9 TS M0 | |
| Microsoft® Windows® for 64-Bit Itanium-based Systems | 9 TS M0 | |
| Microsoft Windows Server 2003 Datacenter 64-bit Edition | 9 TS M0 | |
| Microsoft Windows Server 2003 Enterprise 64-bit Edition | 9 TS M0 | |
| Microsoft Windows 2000 Advanced Server | 9 TS M0 | |
| Microsoft Windows 2000 Datacenter Server | 9 TS M0 | |
| Microsoft Windows 2000 Server | 9 TS M0 | |
| Microsoft Windows 2000 Professional | 9 TS M0 | |
| Microsoft Windows NT Workstation | 9 TS M0 | |
| Microsoft Windows Server 2003 Datacenter Edition | 9 TS M0 | |
| Microsoft Windows Server 2003 Enterprise Edition | 9 TS M0 | |
| Microsoft Windows Server 2003 Standard Edition | 9 TS M0 | |
| Microsoft Windows XP Professional | 9 TS M0 | |
| 64-bit Enabled AIX | 9 TS M0 | |
| 64-bit Enabled HP-UX | 9 TS M0 | |
| 64-bit Enabled Solaris | 9 TS M0 | |
| HP-UX IPF | 9 TS M0 | |
| Linux | 9 TS M0 | |
| OpenVMS Alpha | 9 TS M0 | |
| Tru64 UNIX | 9 TS M0 | |


