Sample 25557: Assign a format to a response variable using PROC GMAP
 |  |  |  |  |
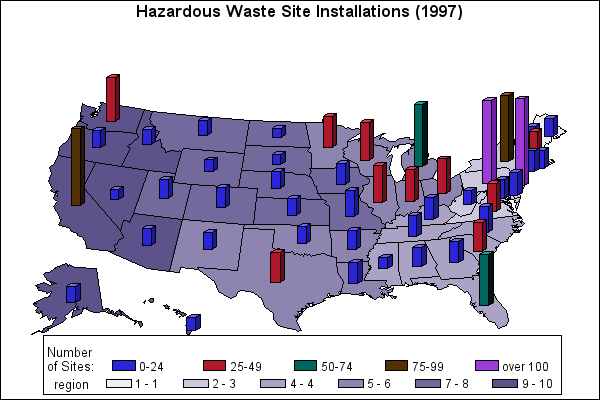
This example creates a format for use with PROC GMAP that defines the ranges of values for the response values and assigns this format to the response variable.
These sample files and code examples are provided by SAS Institute Inc. "as is" without warranty of any kind, either express or implied, including but not limited to the implied warranties of merchantability and fitness for a particular purpose. Recipients acknowledge and agree that SAS Institute shall not be liable for any damages whatsoever arising out of their use of this material. In addition, SAS Institute will provide no support for the materials contained herein.
This example creates a format for use with PROC GMAP that defines the ranges of values for the response values and assigns this format to the response variable.
The graphics output in the Results tab was produced using SAS® 9.2. Submitting the sample code with releases of SAS prior to SAS 9.2 might produce different results.
 /* Define the libref of MAPS if necessary */
*libname maps 'SAS-MAPS-library';

 /* Set the graphics environment */
goptions reset=all border cback=white htitle=13pt;

 /* Create the SITES data set */
data sites;
   length stcode $ 2;
   input region stcode $ sites;
   state=stfips(stcode);
   datalines;
6   AR  12
10  AK  7
4   AL  12
9   AZ  10
9   CA  90
8   CO  15
1   CT  15
3   DE  18
4   FL  52
4   GA  15
9   HI  4
7   IA  16
10  ID  8
5   IL  38
5   IN  30
7   KS  10
4   KY  16
6   LA  15
1   MA  30
3   MD  13
1   ME  12
5   MI  72
5   MN  30
7   MO  22
4   MS  1
8   MT  8
4   NC  22
8   ND  0
7   NE  10
1   NH  18
2   NJ  105
6   NM  9
9   NV  1
2   NY  78
5   OH  34
6   OK  10
10  OR  10
3   PA  100
1   RI  12
4   SC  26
8   SD  2
4   TN  14
6   TX  26
8   UT  12
3   VA  25
1   VT  8
10  WA  49
5   WI  40
3   WV  6
8   WY  3
;
run;

 /* Create map data set STATES1 by adding   */
 /* REGION to the US map data set           */
data states1;
   set maps.us;
   select;
      when (state in (9,23,25,33,44,50))       region=1;
      when (state in (34,36))                  region=2;
      when (state in (10,11,24,42,51,54))      region=3;
      when (state in (1,12,13,21,28,37,45,47)) region=4;
      when (state in (17,18,26,27,39,55))      region=5;
      when (state in (5,22,35,40,48))          region=6;
      when (state in (19,20,29,31))            region=7;
      when (state in (8,30,38,46,49,56))       region=8;
      when (state in (4,6,15,32))              region=9;
      otherwise                                region=10;
   end;
run;

 /* Sort the new map data set */
proc sort data=states1 out=states2;
   by region state;
run;

 /* Create the format SITESFMT */
proc format;
   value sitesfmt low-24='0-24'
                  25-49='25-49'
                  50-74='50-74'
                  75-99='75-99'
                  100-high='over 100';
run;

 /* Define a title for the map */
title1 'Hazardous Waste Site Installations (1997)';

 /* Define legend characteristics */
legend1 shape=bar(4.5,1) value=(j=l)
        label=('Number' j=l 'of Sites:')
        frame;

 /* Display the block maps */
proc gmap map=states2 data=sites;
   format sites sitesfmt.;
   id region state;
   block sites / discrete
                 area=1
                 legend=legend1
                 shape=block
                 coutline=black
                 cblkout=black
                 ;
run;
quit;
These sample files and code examples are provided by SAS Institute Inc. "as is" without warranty of any kind, either express or implied, including but not limited to the implied warranties of merchantability and fitness for a particular purpose. Recipients acknowledge and agree that SAS Institute shall not be liable for any damages whatsoever arising out of their use of this material. In addition, SAS Institute will provide no support for the materials contained herein.
This example creates a format for use with PROC GMAP that defines the ranges of values for the response values and assigns this format to the response variable.
| Type: | Sample |
| Topic: | SAS Reference ==> Procedures ==> GMAP Query and Reporting ==> Creating Reports ==> Graphical ==> Graph Types ==> Maps |
| Date Modified: | 2005-08-27 03:03:23 |
| Date Created: | 2005-05-23 14:15:23 |
Operating System and Release Information
| Product Family | Product | Host | SAS Release | |
| Starting | Ending | |||
| SAS System | SAS/GRAPH | z/OS | 9 TS M0 | |
| Microsoft® Windows® for 64-Bit Itanium-based Systems | 9 TS M0 | |||
| Microsoft Windows Server 2003 Datacenter 64-bit Edition | 9 TS M0 | |||
| Microsoft Windows Server 2003 Enterprise 64-bit Edition | 9 TS M0 | |||
| Microsoft Windows 2000 Advanced Server | 9 TS M0 | |||
| Microsoft Windows 2000 Datacenter Server | 9 TS M0 | |||
| Microsoft Windows 2000 Server | 9 TS M0 | |||
| Microsoft Windows 2000 Professional | 9 TS M0 | |||
| Microsoft Windows NT Workstation | 9 TS M0 | |||
| Microsoft Windows Server 2003 Datacenter Edition | 9 TS M0 | |||
| Microsoft Windows Server 2003 Enterprise Edition | 9 TS M0 | |||
| Microsoft Windows Server 2003 Standard Edition | 9 TS M0 | |||
| Microsoft Windows XP Professional | 9 TS M0 | |||
| 64-bit Enabled AIX | 9 TS M0 | |||
| 64-bit Enabled HP-UX | 9 TS M0 | |||
| 64-bit Enabled Solaris | 9 TS M0 | |||
| HP-UX IPF | 9 TS M0 | |||
| Linux | 9 TS M0 | |||
| OpenVMS Alpha | 9 TS M0 | |||
| Tru64 UNIX | 9 TS M0 | |||