Sample 25546: Producing a basic radar chart using PROC GRADAR
 |  |  |  |  |
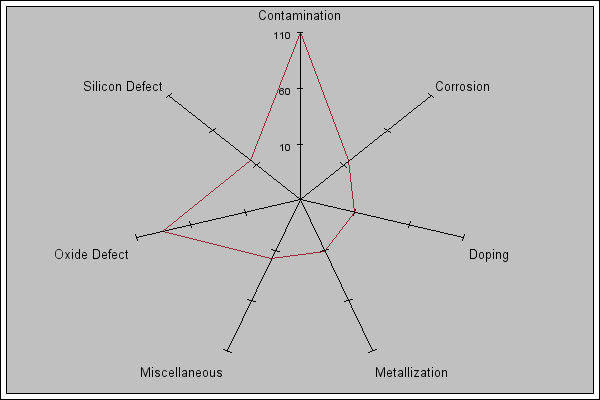
The sample code on the Full Code tab uses PROC GRADAR with the FREQ, CSTARS, and CFRAME options in the CHART statement to specify the vertex lengths, the color for the outline of the stars, and the color to use to fill the axis area of the chart.
These sample files and code examples are provided by SAS Institute Inc. "as is" without warranty of any kind, either express or implied, including but not limited to the implied warranties of merchantability and fitness for a particular purpose. Recipients acknowledge and agree that SAS Institute shall not be liable for any damages whatsoever arising out of their use of this material. In addition, SAS Institute will provide no support for the materials contained herein.
This sample uses PROC GRADAR with the FREQ, CSTARS, and CFRAME options in the CHART statement to specify the vertex lengths, the color for the outline of the stars, and the color to use to fill the axis area of the chart.
The graphics output on the Results tab was produced using SAS® 9.2. Submitting the sample code with releases of SAS prior to SAS 9.2 might produce different results.
 /* Set the graphics environment */
goptions reset=all cback=white border htitle=12pt htext=10pt;

 /* Create a sample data set */
data failure;
   label  cause   = 'Cause of Failure' ;
   input  process $ 1-9 day $ 13-19 cause $ 23-36 count 40-41;
   datalines;
Process A   March 1   Contamination    15
Process A   March 1   Corrosion         2
Process A   March 1   Doping            1
Process A   March 1   Metallization     2
Process A   March 1   Miscellaneous     3
Process A   March 1   Oxide Defect      8
Process A   March 1   Silicon Defect    1
Process A   March 2   Contamination    16
Process A   March 2   Corrosion         3
Process A   March 2   Doping            1
Process A   March 2   Metallization     3
Process A   March 2   Miscellaneous     1
Process A   March 2   Oxide Defect      9
Process A   March 2   Silicon Defect    2
Process A   March 3   Contamination    20
Process A   March 3   Corrosion         1
Process A   March 3   Doping            1
Process A   March 3   Metallization     0
Process A   March 3   Miscellaneous     3
Process A   March 3   Oxide Defect      7
Process A   March 3   Silicon Defect    2
Process A   March 4   Contamination    12
Process A   March 4   Corrosion         1
Process A   March 4   Doping            1
Process A   March 4   Metallization     0
Process A   March 4   Miscellaneous     0
Process A   March 4   Oxide Defect     10
Process A   March 4   Silicon Defect    1
Process A   March 5   Contamination    23
Process A   March 5   Corrosion         1
Process A   March 5   Doping            1
Process A   March 5   Metallization     0
Process A   March 5   Miscellaneous     1
Process A   March 5   Oxide Defect      8
Process A   March 5   Silicon Defect    2
Process B   March 1   Contamination     8
Process B   March 1   Corrosion         2
Process B   March 1   Doping            1
Process B   March 1   Metallization     4
Process B   March 1   Miscellaneous     2
Process B   March 1   Oxide Defect     10
Process B   March 1   Silicon Defect    3
Process B   March 2   Contamination     9
Process B   March 2   Corrosion         0
Process B   March 2   Doping            1
Process B   March 2   Metallization     2
Process B   March 2   Miscellaneous     4
Process B   March 2   Oxide Defect      9
Process B   March 2   Silicon Defect    2
Process B   March 3   Contamination     4
Process B   March 3   Corrosion         1
Process B   March 3   Doping            1
Process B   March 3   Metallization     0
Process B   March 3   Miscellaneous     0
Process B   March 3   Oxide Defect     10
Process B   March 3   Silicon Defect    1
Process B   March 4   Contamination     2
Process B   March 4   Corrosion         2
Process B   March 4   Doping            1
Process B   March 4   Metallization     0
Process B   March 4   Miscellaneous     3
Process B   March 4   Oxide Defect      7
Process B   March 4   Silicon Defect    1
Process B   March 5   Contamination     1
Process B   March 5   Corrosion         3
Process B   March 5   Doping            1
Process B   March 5   Metallization     0
Process B   March 5   Miscellaneous     1
Process B   March 5   Oxide Defect      8
Process B   March 5   Silicon Defect    2
;
run;

 /* Use the CHART statement and the Cause variable to produce a radar chart */
proc gradar data=failure;
    chart cause / freq=count
                  cstars=depk
                  cframe=ltgray
                  ;
run;
quit;
These sample files and code examples are provided by SAS Institute Inc. "as is" without warranty of any kind, either express or implied, including but not limited to the implied warranties of merchantability and fitness for a particular purpose. Recipients acknowledge and agree that SAS Institute shall not be liable for any damages whatsoever arising out of their use of this material. In addition, SAS Institute will provide no support for the materials contained herein.
This sample uses PROC GRADAR with the FREQ, CSTARS, and CFRAME options in the CHART statement in order to specify the vertex lengths, the color for the outline of the stars, and the color to use to fill the axis area of the chart.
| Type: | Sample |
| Topic: | SAS Reference ==> Procedures ==> GRADAR Query and Reporting ==> Creating Reports ==> Graphical ==> Graph Types ==> Charts ==> Radar |
| Date Modified: | 2005-08-27 03:03:21 |
| Date Created: | 2005-05-23 14:14:40 |
Operating System and Release Information
| Product Family | Product | Host | SAS Release | |
| Starting | Ending | |||
| SAS System | SAS/GRAPH | All | 9.1 TS1M0 | n/a |