Sample 25524: Generating a simple contour plot using PROC GCONTOUR
 |  |  |  |  |
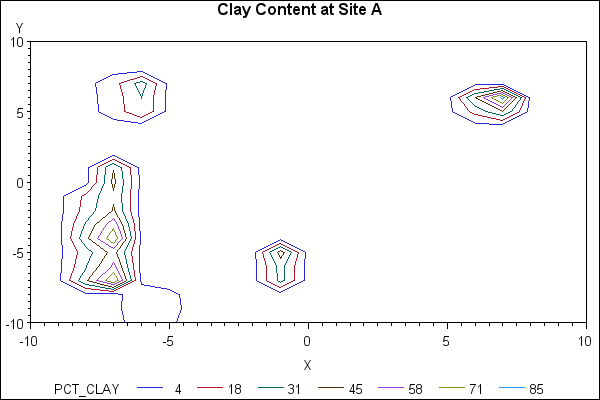
This sample uses PROC GCONTOUR to produce a simple contour plot. It first uses the G3GRID procedure to interpolate percentages for grid cells that do not have percentages in the data.
These sample files and code examples are provided by SAS Institute Inc. "as is" without warranty of any kind, either express or implied, including but not limited to the implied warranties of merchantability and fitness for a particular purpose. Recipients acknowledge and agree that SAS Institute shall not be liable for any damages whatsoever arising out of their use of this material. In addition, SAS Institute will provide no support for the materials contained herein.
This sample uses PROC GCONTOUR to produce a simple contour plot. It first uses the G3GRID procedure to interpolate percentages for grid cells that do not have percentages in the data.
The graphics output in the Results tab was produced using SAS® 9.2. Submitting the sample code with releases of SAS prior to SAS 9.2 might produce different results.
/* Set the graphics environment */
goptions reset=all cback=white border htitle=12pt htext=10pt;
/* Create the WORK.CLAY data set */
data clay;
input X Y PCT_CLAY;
datalines;
-10 -10 2.316
-10 -9 1.816
-10 -8 2.427
-10 -7 2.543
-10 -6 2.215
-10 -5 1.601
-10 -4 2.070
-10 -3 1.293
-10 -2 0.498
-10 -1 1.085
-10 0 2.421
-10 1 1.584
-10 2 0.220
-10 3 0.159
-10 4 0.116
-10 5 0.063
-10 6 0.073
-10 7 0.078
-10 8 0.197
-10 9 0.144
-10 10 0.134
-9 -10 0.280
-9 -9 0.166
-9 -8 0.174
-9 -7 0.670
-9 -6 0.403
-9 -5 0.488
-9 -4 0.020
-9 -3 0.040
-9 -2 0.060
-9 -1 0.126
-9 0 0.118
-9 1 0.048
-9 2 4.214
-9 3 0.103
-9 4 0.137
-9 5 0.043
-9 6 0.057
-9 7 0.154
-9 8 0.048
-9 9 0.053
-9 10 0.083
-8 -10 0.100
-8 -9 0.100
-8 -8 .
-8 -7 .
-8 -6 .
-8 -5 .
-8 -4 .
-8 -3 .
-8 -2 .
-8 -1 .
-8 0 0.133
-8 1 0.133
-8 2 0.100
-8 3 0.055
-8 4 0.040
-8 5 0.045
-8 6 0.030
-8 7 0.030
-8 8 0.025
-8 9 0.030
-8 10 0.020
-7 -10 0.140
-7 -9 0.080
-7 -8 0.060
-7 -7 84.500
-7 -6 60.580
-7 -5 50.060
-7 -4 82.600
-7 -3 66.000
-7 -2 46.000
-7 -1 42.600
-7 0 47.667
-7 1 43.750
-7 2 0.043
-7 3 0.055
-7 4 0.056
-7 5 9.690
-7 6 10.485
-7 7 12.524
-7 8 0.071
-7 9 0.032
-7 10 0.039
-6 -10 11.341
-6 -9 15.297
-6 -8 13.828
-6 -7 0.079
-6 -6 0.055
-6 -5 0.063
-6 -4 0.060
-6 -3 0.040
-6 -2 0.030
-6 -1 0.030
-6 0 0.040
-6 1 0.040
-6 2 0.020
-6 3 0.060
-6 4 0.030
-6 5 31.007
-6 6 31.172
-6 7 37.505
-6 8 .
-6 9 .
-6 10 .
-5 -10 .
-5 -9 .
-5 -8 .
-5 -7 .
-5 -6 .
-5 -5 .
-5 -4 0.118
-5 -3 0.090
-5 -2 0.062
-5 -1 0.064
-5 0 0.040
-5 1 0.060
-5 2 0.047
-5 3 0.056
-5 4 0.048
-5 5 0.098
-5 6 0.047
-5 7 0.056
-5 8 0.262
-5 9 0.149
-5 10 0.115
-4 -10 0.363
-4 -9 0.094
-4 -8 0.236
-4 -7 0.122
-4 -6 0.102
-4 -5 0.121
-4 -4 0.127
-4 -3 0.098
-4 -2 0.211
-4 -1 .
-4 0 .
-4 1 .
-4 2 .
-4 3 .
-4 4 .
-4 5 .
-4 6 .
-4 7 .
-4 8 .
-4 9 .
-4 10 .
-3 -10 1.833
-3 -9 0.300
-3 -8 0.167
-3 -7 0.800
-3 -6 1.700
-3 -5 .
-3 -4 .
-3 -3 .
-3 -2 .
-3 -1 2.500
-3 0 .
-3 1 2.000
-3 2 0.044
-3 3 0.028
-3 4 0.032
-3 5 0.019
-3 6 0.011
-3 7 0.018
-3 8 0.017
-3 9 0.015
-3 10 0.016
-2 -10 0.007
-2 -9 0.021
-2 -8 0.012
-2 -7 0.086
-2 -6 0.086
-2 -5 0.104
-2 -4 0.039
-2 -3 0.071
-2 -2 0.057
-2 -1 0.124
-2 0 0.096
-2 1 0.101
-2 2 0.019
-2 3 0.046
-2 4 0.038
-2 5 .
-2 6 .
-2 7 .
-2 8 .
-2 9 .
-2 10 .
-1 -10 .
-1 -9 .
-1 -8 .
-1 -7 35.667
-1 -6 36.000
-1 -5 51.000
-1 -4 .
-1 -3 .
-1 -2 .
-1 -1 .
-1 0 .
-1 1 .
-1 2 .
-1 3 .
-1 4 .
-1 5 0.058
-1 6 0.070
-1 7 0.076
-1 8 0.074
-1 9 0.084
-1 10 0.055
0 -10 0.085
0 -9 0.067
0 -8 0.057
0 -7 0.044
0 -6 0.039
0 -5 0.036
0 -4 0.092
0 -3 0.048
0 -2 .
0 -1 0.058
0 0 0.059
0 1 0.049
0 2 0.075
0 3 0.055
0 4 0.080
0 5 0.075
0 6 0.055
0 7 0.065
0 8 0.087
0 9 0.050
0 10 0.056
1 -10 0.039
1 -9 0.057
1 -8 0.055
1 -7 0.058
1 -6 0.056
1 -5 0.061
1 -4 0.045
1 -3 0.041
1 -2 0.033
1 -1 .
1 0 0.643
1 1 .
1 2 .
1 3 1.156
1 4 .
1 5 .
1 6 1.453
1 7 .
1 8 .
1 9 .
1 10 .
2 -10 0.070
2 -9 0.070
2 -8 0.076
2 -7 0.078
2 -6 0.076
2 -5 0.070
2 -4 0.070
2 -3 0.072
2 -2 0.074
2 -1 0.070
2 0 0.070
2 1 0.082
2 2 1.761
2 3 0.630
2 4 1.365
2 5 0.419
2 6 1.661
2 7 0.796
2 8 0.467
2 9 0.829
2 10 1.033
3 -10 0.453
3 -9 1.372
3 -8 1.046
3 -7 2.831
3 -6 2.225
3 -5 1.535
3 -4 2.792
3 -3 2.187
3 -2 3.153
3 -1 2.290
3 0 4.347
3 1 3.318
3 2 2.964
3 3 1.446
3 4 2.607
3 5 0.430
3 6 0.323
3 7 1.095
3 8 0.212
3 9 0.094
3 10 0.232
4 -10 0.215
4 -9 0.710
4 -8 0.846
4 -7 0.228
4 -6 0.618
4 -5 0.423
4 -4 .
4 -3 .
4 -2 .
4 -1 .
4 0 .
4 1 .
4 2 .
4 3 .
4 4 .
4 5 0.113
4 6 0.087
4 7 0.066
4 8 0.067
4 9 0.076
4 10 0.045
5 -10 0.072
5 -9 0.052
5 -8 0.047
5 -7 0.071
5 -6 0.089
5 -5 0.067
5 -4 0.244
5 -3 0.257
5 -2 0.180
5 -1 0.181
5 0 0.146
5 1 0.144
5 2 0.412
5 3 0.208
5 4 0.152
5 5 0.184
5 6 0.098
5 7 0.137
5 8 0.556
5 9 1.068
5 10 0.123
6 -10 0.864
6 -9 0.770
6 -8 0.378
6 -7 0.390
6 -6 0.253
6 -5 0.148
6 -4 0.664
6 -3 0.777
6 -2 0.248
6 -1 .
6 0 .
6 1 .
6 2 .
6 3 .
6 4 .
6 5 .
6 6 .
6 7 .
6 8 .
6 9 .
6 10 .
7 -10 .
7 -9 .
7 -8 .
7 -7 .
7 -6 .
7 -5 .
7 -4 .
7 -3 .
7 -2 .
7 -1 .
7 0 .
7 1 .
7 2 0.120
7 3 0.080
7 4 0.060
7 5 .
7 6 89.035
7 7 0.470
7 8 0.060
7 9 0.060
7 10 0.302
8 -10 0.090
8 -9 0.070
8 -8 0.040
8 -7 .
8 -6 .
8 -5 .
8 -4 0.170
8 -3 0.170
8 -2 0.230
8 -1 0.083
8 0 0.101
8 1 0.146
8 2 .
8 3 .
8 4 0.060
8 5 0.150
8 6 0.230
8 7 0.130
8 8 0.110
8 9 0.120
8 10 0.110
9 -10 0.110
9 -9 0.100
9 -8 .
9 -7 0.130
9 -6 0.110
9 -5 0.110
9 -4 0.804
9 -3 0.341
9 -2 0.264
9 -1 0.354
9 0 0.300
9 1 0.220
9 2 0.296
9 3 0.343
9 4 0.264
9 5 0.374
9 6 0.442
9 7 0.209
9 8 0.097
9 9 0.063
9 10 0.048
10 -10 0.056
10 -9 0.088
10 -8 0.058
10 -7 0.076
10 -6 0.068
10 -5 0.058
10 -4 0.058
10 -3 0.058
10 -2 0.063
10 -1 0.100
10 0 0.062
10 1 0.036
10 2 0.025
10 3 0.027
10 4 0.035
10 5 0.025
10 6 .
10 7 .
10 8 .
10 9 .
10 10 .
;
run;
/* Interpolate the WORK.CLAY2 data set */
proc g3grid data=clay out=clay2;
grid y*x=pct_clay / naxis1=21
naxis2=21
join;
run;
/* Add a title to the graph */
title1 'Clay Content at Site A';
/* Create the contour graph */
proc gcontour data=clay2;
format pct_clay 2.0;
plot y*x=pct_clay;
run;
quit;
These sample files and code examples are provided by SAS Institute Inc. "as is" without warranty of any kind, either express or implied, including but not limited to the implied warranties of merchantability and fitness for a particular purpose. Recipients acknowledge and agree that SAS Institute shall not be liable for any damages whatsoever arising out of their use of this material. In addition, SAS Institute will provide no support for the materials contained herein.
This sample uses PROC GCONTOUR to produce a simple contour plot. It first uses the G3GRID procedure to interpolate percentages for grid cells that do not have percentages in the data.
| Type: | Sample |
| Topic: | SAS Reference ==> Procedures ==> GCONTOUR |
| Date Modified: | 2005-08-27 03:03:18 |
| Date Created: | 2005-05-23 14:13:11 |
Operating System and Release Information
| Product Family | Product | Host | SAS Release | |
| Starting | Ending | |||
| SAS System | SAS/GRAPH | z/OS | 9.1 TS1M0 | |
| Microsoft® Windows® for 64-Bit Itanium-based Systems | 9.1 TS1M0 | |||
| Microsoft Windows Server 2003 Datacenter 64-bit Edition | 9.1 TS1M0 | |||
| Microsoft Windows Server 2003 Enterprise 64-bit Edition | 9.1 TS1M0 | |||
| Microsoft Windows 2000 Advanced Server | 9.1 TS1M0 | |||
| Microsoft Windows 2000 Datacenter Server | 9.1 TS1M0 | |||
| Microsoft Windows 2000 Server | 9.1 TS1M0 | |||
| Microsoft Windows 2000 Professional | 9.1 TS1M0 | |||
| Microsoft Windows NT Workstation | 9.1 TS1M0 | |||
| Microsoft Windows Server 2003 Datacenter Edition | 9.1 TS1M0 | |||
| Microsoft Windows Server 2003 Enterprise Edition | 9.1 TS1M0 | |||
| Microsoft Windows Server 2003 Standard Edition | 9.1 TS1M0 | |||
| Microsoft Windows XP Professional | 9.1 TS1M0 | |||
| 64-bit Enabled AIX | 9.1 TS1M0 | |||
| 64-bit Enabled HP-UX | 9.1 TS1M0 | |||
| 64-bit Enabled Solaris | 9.1 TS1M0 | |||
| HP-UX IPF | 9.1 TS1M0 | |||
| Linux | 9.1 TS1M0 | |||
| OpenVMS Alpha | 9.1 TS1M0 | |||
| Tru64 UNIX | 9.1 TS1M0 | |||