Sample 25513: Sum statistic in bar charts using PROC GCHART
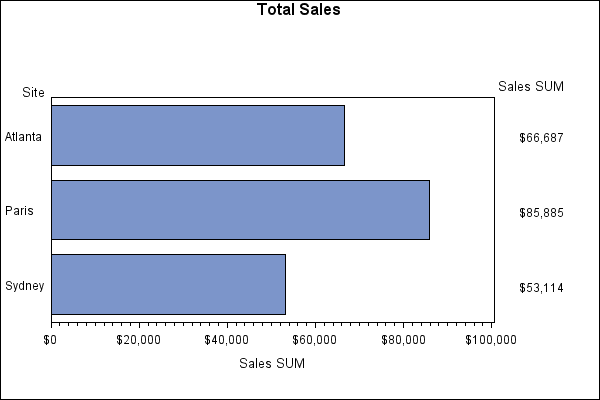
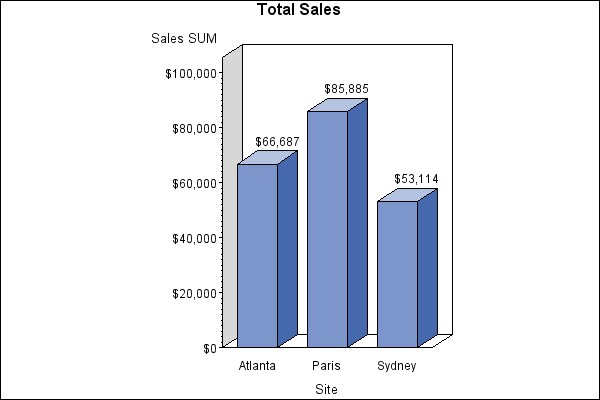
This sample code produces two bar charts. The horizontal bar chart displays the sum statistic to the right of the bar. The vertical bar chart displays the sum statistic at the top of each bar.
These sample files and code examples are provided by SAS Institute
Inc. "as is" without warranty of any kind, either express or implied, including
but not limited to the implied warranties of merchantability and fitness for a
particular purpose. Recipients acknowledge and agree that SAS Institute shall
not be liable for any damages whatsoever arising out of their use of this material.
In addition, SAS Institute will provide no support for the materials contained herein.
This sample code produces two bar charts. The horizontal bar chart displays the sum statistic to the right of the bar. The vertical bar chart displays the sum statistic at the top of each bar.
The graphics output in the Results tab was produced using SAS® 9.2. Submitting the sample code with releases of SAS prior to SAS 9.2 might produce different results.
 /* Set the graphics environment */
goptions reset=all border cback=white
           htitle=12pt;

 /* Create data set TOTALS */
data totals;
   length Dept $ 7 Site $ 8;
   input Dept Site Quarter Sales;
   datalines;
Parts   Sydney  1 4043.97
Parts   Atlanta 1 6225.26
Parts   Paris   1 3543.97
Repairs Sydney  1 5592.82
Repairs Atlanta 1 9210.21
Repairs Paris   1 8591.98
Tools   Sydney  1 1775.74
Tools   Atlanta 1 2424.19
Tools   Paris   1 5914.25
Parts   Sydney  2 3723.44
Parts   Atlanta 2 11595.07
Parts   Paris   2 9558.29
Repairs Sydney  2 5505.31
Repairs Atlanta 2 4589.59
Repairs Paris   2 7538.56
Tools   Sydney  2 2945.17
Tools   Atlanta 2 1903.99
Tools   Paris   2 7868.34
Parts   Sydney  3 8437.96
Parts   Atlanta 3 6847.91
Parts   Paris   3 6789.85
Repairs Sydney  3 4426.46
Repairs Atlanta 3 5011.66
Repairs Paris   3 6510.38
Tools   Sydney  3 3767.10
Tools   Atlanta 3 3048.52
Tools   Paris   3 9017.96
Parts   Sydney  4 6065.57
Parts   Atlanta 4 9388.51
Parts   Paris   4 8509.08
Repairs Sydney  4 3012.99
Repairs Atlanta 4 2088.30
Repairs Paris   4 5530.37
Tools   Sydney  4 3817.36
Tools   Atlanta 4 4354.18
Tools   Paris   4 6511.70
;
run;

 /* Define the title for the chart */
title1 'Total Sales';

axis1 order=(0 to 100000 by 20000);

 /* Generate the horizontal bar chart */
proc gchart data=totals;
   format sales dollar8.;
   hbar site / sumvar=sales width=6 sum raxis=axis1;
run;

 /* Generate vertical bar chart */
   vbar3d site / sumvar=sales coutline=black sum
                 width=8 space=6 raxis=axis1;
run;
quit;
These sample files and code examples are provided by SAS Institute
Inc. "as is" without warranty of any kind, either express or implied, including
but not limited to the implied warranties of merchantability and fitness for a
particular purpose. Recipients acknowledge and agree that SAS Institute shall
not be liable for any damages whatsoever arising out of their use of this material.
In addition, SAS Institute will provide no support for the materials contained herein.
This example produces two bar charts. The horizontal bar chart displays the sum statistic to the right of the bar. The vertical bar chart displays the sum statistic at the top of each bar.
| Type: | Sample |
| Topic: | Query and Reporting ==> Creating Reports ==> Graphical ==> Graph Types ==> Charts ==> Bar
SAS Reference ==> Procedures ==> GCHART
|
| Date Modified: | 2005-08-24 16:06:35 |
| Date Created: | 2005-05-23 14:12:28 |
Operating System and Release Information
| SAS System | SAS/GRAPH | z/OS | 9.1 TS1M0 | |
| Microsoft® Windows® for 64-Bit Itanium-based Systems | 9.1 TS1M0 | |
| Microsoft Windows Server 2003 Datacenter 64-bit Edition | 9.1 TS1M0 | |
| Microsoft Windows Server 2003 Enterprise 64-bit Edition | 9.1 TS1M0 | |
| Microsoft Windows 2000 Advanced Server | 9.1 TS1M0 | |
| Microsoft Windows 2000 Datacenter Server | 9.1 TS1M0 | |
| Microsoft Windows 2000 Server | 9.1 TS1M0 | |
| Microsoft Windows 2000 Professional | 9.1 TS1M0 | |
| Microsoft Windows NT Workstation | 9.1 TS1M0 | |
| Microsoft Windows Server 2003 Datacenter Edition | 9.1 TS1M0 | |
| Microsoft Windows Server 2003 Enterprise Edition | 9.1 TS1M0 | |
| Microsoft Windows Server 2003 Standard Edition | 9.1 TS1M0 | |
| Microsoft Windows XP Professional | 9.1 TS1M0 | |
| 64-bit Enabled AIX | 9.1 TS1M0 | |
| 64-bit Enabled HP-UX | 9.1 TS1M0 | |
| 64-bit Enabled Solaris | 9.1 TS1M0 | |
| HP-UX IPF | 9.1 TS1M0 | |
| Linux | 9.1 TS1M0 | |
| OpenVMS Alpha | 9.1 TS1M0 | |
| Tru64 UNIX | 9.1 TS1M0 | |


