Sample 25512: Create a horizontal bar chart with a table of descriptive statistics with PROC GCHART
 |  |  |  |  |
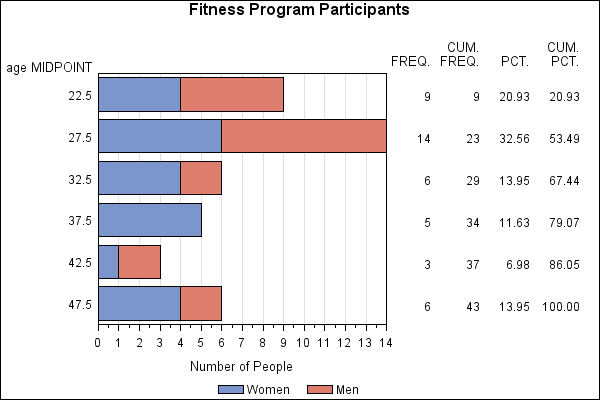
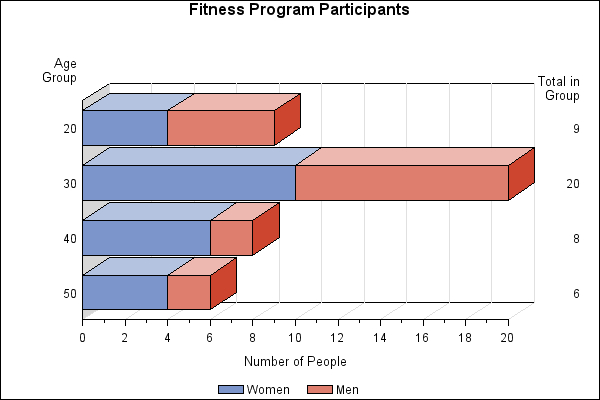
The sample code on the Full Code tab produces a horizontal bar chart using PROC GCHART with descriptive statistic values printed in a table to the right of the bar chart.
These sample files and code examples are provided by SAS Institute Inc. "as is" without warranty of any kind, either express or implied, including but not limited to the implied warranties of merchantability and fitness for a particular purpose. Recipients acknowledge and agree that SAS Institute shall not be liable for any damages whatsoever arising out of their use of this material. In addition, SAS Institute will provide no support for the materials contained herein.
This example produces a horizontal bar chart using PROC GCHART with descriptive statistic values printed in a table to the right of the bar chart.
The graphics output in the Results tab was produced using SAS® 9.2. Submitting the sample code with releases of SAS prior to SAS 9.2 might produce different results.
 /* Set the graphics environment */
goptions reset=all border cback=white htitle=12pt;

 /* Create the FITNESS data set */
data fitness;
   input age sex $ heart exer aero;
   datalines;
28  M  86  2   36.6
41  M  76  3   26.7
30  M  78  2   33.8
39  F  90  1   13.6
28  M  96  1   33.
26  M  74  2   42.7
 .  F  66  4   36.1
48  F  72  2   22.6
31  M  60  3   44.1
28  F  84  2   22.1
33  F  56  4   21.3
37  F  78  2   30.3
46  M  84  1   34.2
23  M  72  2   38.1
25  F  88  1   32.0
37  F  72  2   43.7
42  M  60  3   36.7
44  F  78  3   21.6
 .  F  70  1   22.8
25  F  60  3   36.1
24  F  74  2   29.9
29  F  66  4   38.9
27  M  62  4   44.0
24  M  72  3   44.2
36  F  80  1   26.2
24  M  82  2   18.7
23  M  54  3   70.6
28  F  76  1   23.8
30  F  66  2   28.9
25  M  54  3   41.3
48  F  72  2   28.9
23  F  68  1   18.9
22  F  78  2   39.0
23  F  66  3   36.1
46  F  54  3   28.9
31  F  84  1   21.6
45  M  60  2   47.8
27  M  90  2   43.1
26  M  66  2   28.9
26  F  84  2     .
24  M  72  3   50.1
32  F  72  1   15.7
29  M  54  3   44.8
48  F  66  2   28.9
36  F  66  2   33.2
;
run;

title1 'Fitness Program Participants';

 /* Define response axis characteristics */
axis1 label=('Number of People')
      minor=(number=1)
      offset=(0,0);

 /* Define legend characteristics */
legend1 label=none value=('Women' 'Men');

 /* Chart the values of AGE */
proc gchart data=fitness;
   hbar age / subgroup=sex
              legend=legend1
              autoref
              clipref
              coutline=black
              raxis=axis1;
run;

   /* Add order= to response axis */
   axis1 order=(0 to 20 by 2)
         label=('Number of People')
         minor=(number=1)
         offset=(0,0);

   /* Modify midpoint axis label*/
   axis2 label=('Age' j=r 'Group');

   /* Create chart */
   hbar3d age / midpoints=(20 30 40 50)
                freq
                freqlabel='Total in Group'
                subgroup=sex
                autoref
                maxis=axis2
                raxis=axis1
                legend=legend1
                coutline=black
	        width=3.5
                space=2;
run;
quit;
These sample files and code examples are provided by SAS Institute Inc. "as is" without warranty of any kind, either express or implied, including but not limited to the implied warranties of merchantability and fitness for a particular purpose. Recipients acknowledge and agree that SAS Institute shall not be liable for any damages whatsoever arising out of their use of this material. In addition, SAS Institute will provide no support for the materials contained herein.
This example produces a horizontal bar chart using PROC GCHART with descriptive statistic values printed in a table to the right of the bar chart.
| Type: | Sample |
| Topic: | Query and Reporting ==> Creating Reports ==> Graphical ==> Graph Types ==> Charts ==> Bar SAS Reference ==> Procedures ==> GCHART |
| Date Modified: | 2005-08-13 03:02:43 |
| Date Created: | 2005-05-23 14:12:24 |
Operating System and Release Information
| Product Family | Product | Host | SAS Release | |
| Starting | Ending | |||
| SAS System | SAS/GRAPH | z/OS | 9.1 TS1M0 | |
| Microsoft® Windows® for 64-Bit Itanium-based Systems | 9.1 TS1M0 | |||
| Microsoft Windows Server 2003 Datacenter 64-bit Edition | 9.1 TS1M0 | |||
| Microsoft Windows Server 2003 Enterprise 64-bit Edition | 9.1 TS1M0 | |||
| Microsoft Windows 2000 Advanced Server | 9.1 TS1M0 | |||
| Microsoft Windows 2000 Datacenter Server | 9.1 TS1M0 | |||
| Microsoft Windows 2000 Server | 9.1 TS1M0 | |||
| Microsoft Windows 2000 Professional | 9.1 TS1M0 | |||
| Microsoft Windows NT Workstation | 9.1 TS1M0 | |||
| Microsoft Windows Server 2003 Datacenter Edition | 9.1 TS1M0 | |||
| Microsoft Windows Server 2003 Enterprise Edition | 9.1 TS1M0 | |||
| Microsoft Windows Server 2003 Standard Edition | 9.1 TS1M0 | |||
| Microsoft Windows XP Professional | 9.1 TS1M0 | |||
| 64-bit Enabled AIX | 9.1 TS1M0 | |||
| 64-bit Enabled HP-UX | 9.1 TS1M0 | |||
| 64-bit Enabled Solaris | 9.1 TS1M0 | |||
| HP-UX IPF | 9.1 TS1M0 | |||
| Linux | 9.1 TS1M0 | |||
| OpenVMS Alpha | 9.1 TS1M0 | |||
| Tru64 UNIX | 9.1 TS1M0 | |||