Sample 25508: Use BY groups to make a series of charts with PROC GCHART
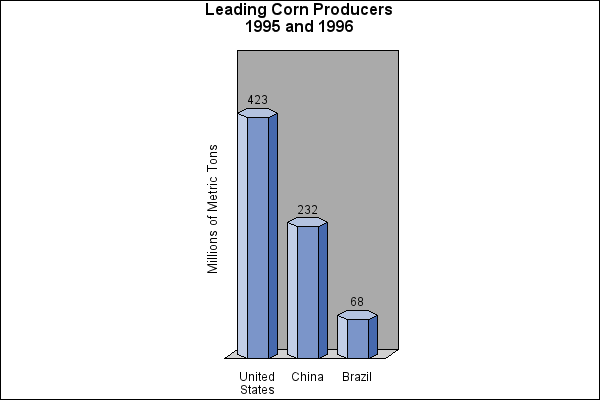
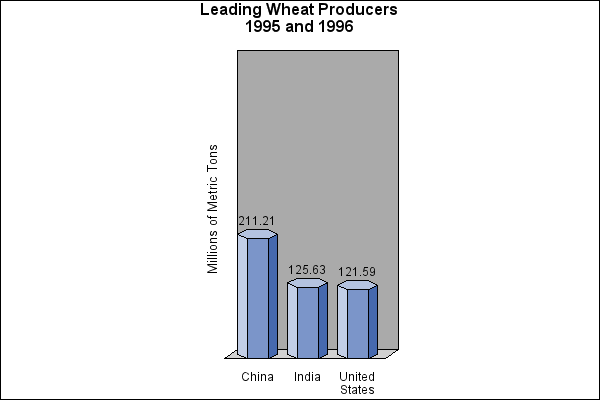
The sample code on the Full Code tab uses a BY statement with the GCHART procedure to produce a separate 3D vertical bar chart for each value of the BY variable TYPE.
These sample files and code examples are provided by SAS Institute
Inc. "as is" without warranty of any kind, either express or implied, including
but not limited to the implied warranties of merchantability and fitness for a
particular purpose. Recipients acknowledge and agree that SAS Institute shall
not be liable for any damages whatsoever arising out of their use of this material.
In addition, SAS Institute will provide no support for the materials contained herein.
This example uses a BY statement with the GCHART procedure to produce a separate 3D vertical bar chart for each value of the BY variable TYPE.
The graphics output in the Results tab was produced using SAS® 9.2. Submitting the sample code with releases of SAS prior to SAS 9.2 might produce different results.
 /* Set the graphics environment */
goptions reset=all border cback=white htitle=12pt;

 /* Add the data set GRAINLDR */
data grainldr;
   length country $ 3 type $ 5;
   input year country $ type $ amount;
   megtons=amount/1000;
   datalines;
1995 BRZ  Wheat    1516
1995 BRZ  Rice     11236
1995 BRZ  Corn     36276
1995 CHN  Wheat    102207
1995 CHN  Rice     185226
1995 CHN  Corn     112331
1995 IND  Wheat    63007
1995 IND  Rice     122372
1995 IND  Corn     9800
1995 INS  Wheat    .
1995 INS  Rice     49860
1995 INS  Corn     8223
1995 USA  Wheat    59494
1995 USA  Rice     7888
1995 USA  Corn     187300
1996 BRZ  Wheat    3302
1996 BRZ  Rice     10035
1996 BRZ  Corn     31975
1996 CHN  Wheat    109000
1996 CHN  Rice     190100
1996 CHN  Corn     119350
1996 IND  Wheat    62620
1996 IND  Rice     120012
1996 IND  Corn     8660
1996 INS  Wheat    .
1996 INS  Rice     51165
1996 INS  Corn     8925
1996 USA  Wheat    62099
1996 USA  Rice     7771
1996 USA  Corn     236064
;
run;

 /* Create a format for the values of COUNTRY  */
proc format;
   value $country 'BRZ' = 'Brazil'
                  'CHN' = 'China'
                  'IND' = 'India'
                  'INS' = 'Indonesia'
                  'USA' = 'United States';
run;

 /* Suppress the default BY line */
options nobyline;

 /* Define a title for the chart */
title1 'Leading #byval(type) Producers' j=c '1995 and 1996';

 /* Define response axis characteristics */
axis1 order=(0 to 550 by 100)
      label=(angle=90 'Millions of Metric Tons')
      major=none minor=none value=none
      style=0 noplane;

 /* Define midpoint axis characteristics */
axis2 label=none split=' ';

 /* Sort data set TOTALS in order by site */
proc sort data=grainldr out=temp;
   by type;
run;

 /* Generate multiple vertical bar charts (one chart */
 /* for each unique value of the variable TYPE).     */
proc gchart data=temp (where=(megtons gt 31));
   by type;
   format country $country.;
   vbar3d country / sumvar=megtons
                    outside=sum
                    descending
                    shape=hexagon
                    width=8
                    coutline=black
                    cframe=grayaa
                    maxis=axis2
                    raxis=axis1;
run;
quit;
These sample files and code examples are provided by SAS Institute
Inc. "as is" without warranty of any kind, either express or implied, including
but not limited to the implied warranties of merchantability and fitness for a
particular purpose. Recipients acknowledge and agree that SAS Institute shall
not be liable for any damages whatsoever arising out of their use of this material.
In addition, SAS Institute will provide no support for the materials contained herein.
This example uses a BY statement with the GCHART procedure to produce a separate 3D vertical bar chart for each value of the BY variable TYPE.
| Type: | Sample |
| Topic: | Query and Reporting ==> Creating Reports ==> Graphical ==> Graph Types ==> Charts ==> Bar
SAS Reference ==> Procedures ==> GCHART
|
| Date Modified: | 2006-02-22 03:02:43 |
| Date Created: | 2005-05-23 14:12:08 |
Operating System and Release Information
| SAS System | SAS/GRAPH | z/OS | 9.1 TS1M0 | |
| Microsoft® Windows® for 64-Bit Itanium-based Systems | 9.1 TS1M0 | |
| Microsoft Windows Server 2003 Datacenter 64-bit Edition | 9.1 TS1M0 | |
| Microsoft Windows Server 2003 Enterprise 64-bit Edition | 9.1 TS1M0 | |
| Microsoft Windows 2000 Advanced Server | 9.1 TS1M0 | |
| Microsoft Windows 2000 Datacenter Server | 9.1 TS1M0 | |
| Microsoft Windows 2000 Server | 9.1 TS1M0 | |
| Microsoft Windows 2000 Professional | 9.1 TS1M0 | |
| Microsoft Windows NT Workstation | 9.1 TS1M0 | |
| Microsoft Windows Server 2003 Datacenter Edition | 9.1 TS1M0 | |
| Microsoft Windows Server 2003 Enterprise Edition | 9.1 TS1M0 | |
| Microsoft Windows Server 2003 Standard Edition | 9.1 TS1M0 | |
| Microsoft Windows XP Professional | 9.1 TS1M0 | |
| 64-bit Enabled AIX | 9.1 TS1M0 | |
| 64-bit Enabled HP-UX | 9.1 TS1M0 | |
| 64-bit Enabled Solaris | 9.1 TS1M0 | |
| HP-UX IPF | 9.1 TS1M0 | |
| Linux | 9.1 TS1M0 | |
| OpenVMS Alpha | 9.1 TS1M0 | |
| Tru64 UNIX | 9.1 TS1M0 | |