Sample 25506: Order axis tick marks with SAS® date values
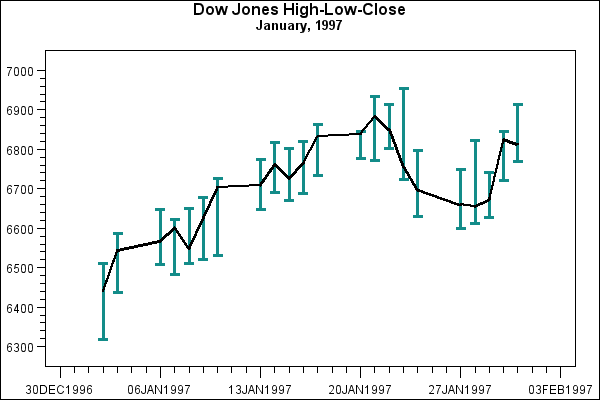
This example uses SAS date values with the ORDER= option on an AXIS statement used with PROC GPLOT to set the major tick marks on the horizontal axis. It also adjusts the position of the first and last major tick marks.
These sample files and code examples are provided by SAS Institute
Inc. "as is" without warranty of any kind, either express or implied, including
but not limited to the implied warranties of merchantability and fitness for a
particular purpose. Recipients acknowledge and agree that SAS Institute shall
not be liable for any damages whatsoever arising out of their use of this material.
In addition, SAS Institute will provide no support for the materials contained herein.
This sample uses SAS date values with the ORDER= option on an AXIS statement used with PROC GPLOT to set the major tick marks on the horizontal axis. It also adjusts the position of the first and last major tick marks.
The graphics output in the Results tab was produced using SAS® 9.2. Submitting the sample code with releases of SAS prior to SAS 9.2 might produce different results.
 /* Set the graphics environment */
goptions reset=all border cback=white htitle=12pt;

 /* Create the data set DOWHLC */
data dowhlc;
   input Date date9. High Low Close;
   format date date9.;
   datalines;
02JAN1997   6511.38  6318.96  6442.49
03JAN1997   6586.42  6437.10  6544.09
06JAN1997   6647.22  6508.30  6567.18
07JAN1997   6621.82  6481.75  6600.66
08JAN1997   6650.30  6509.84  6549.48
09JAN1997   6677.24  6520.23  6625.67
10JAN1997   6725.35  6530.62  6703.79
13JAN1997   6773.45  6647.99  6709.18
14JAN1997   6816.17  6689.94  6762.29
15JAN1997   6800.77  6669.93  6726.88
16JAN1997   6818.47  6688.40  6765.37
17JAN1997   6863.88  6732.66  6833.10
20JAN1997   6839.13  6777.30  6843.87
21JAN1997   6934.69  6771.14  6883.90
22JAN1997   6913.14  6801.16  6850.03
23JAN1997   6953.55  6724.19  6755.75
24JAN1997   6798.08  6629.91  6696.48
27JAN1997   6748.82  6598.73  6660.69
28JAN1997   6823.48  6612.20  6656.08
29JAN1997   6673.39  6627.98  6740.74
30JAN1997   6845.03  6719.96  6823.86
31JAN1997   6912.37  6769.99  6813.09
;
run;

data dowhlc2;
   set dowhlc;
   drop high low close;
   Dow=high; output;
   Dow=low; output;
   Dow=close; output;
run;

 /* Define the graph titles */
title1 'Dow Jones High-Low-Close';
title2 h=10pt 'January, 1997';

 /* Define symbol characteristics */
symbol1 interpol=hiloctj
        cv=vibg
        ci=black
        width=2;

 /* Modify the horizontal axis */
axis1 order=('30DEC1996'd to '03FEB1997'd by week)
      offset=(3,3)
      label=none
      major=(height=1 width=1)
      minor=(number=6 height=.5 width=1)
      width=1;

 /* Modify the vertical axis */
axis2 color=black
      label=none
      major=(height=1.5)
      minor=(number=4 height=1)
      offset=(2,2);

   /* Generate the plot and assign AXIS definitions */
proc gplot data=dowhlc2;
   plot dow*date / haxis=axis1
                   vaxis=axis2;
run;
quit;
These sample files and code examples are provided by SAS Institute
Inc. "as is" without warranty of any kind, either express or implied, including
but not limited to the implied warranties of merchantability and fitness for a
particular purpose. Recipients acknowledge and agree that SAS Institute shall
not be liable for any damages whatsoever arising out of their use of this material.
In addition, SAS Institute will provide no support for the materials contained herein.
This example uses SAS date values with the ORDER= option on an AXIS statement used with PROC GPLOT to set the major tick marks on the horizontal axis. It also adjusts the position of the first and last major tick marks.
| Type: | Sample |
| Topic: | Query and Reporting ==> Creating Reports ==> Graphical ==> Graph Elements ==> Symbols/Interpolation
Query and Reporting ==> Creating Reports ==> Graphical ==> Graph Types ==> Plots ==> Other Plots
SAS Reference ==> Procedures ==> GPLOT
|
| Date Modified: | 2005-07-23 03:02:37 |
| Date Created: | 2005-05-23 14:12:00 |
Operating System and Release Information
| SAS System | SAS/GRAPH | z/OS | 9.1 TS1M0 | |
| Microsoft® Windows® for 64-Bit Itanium-based Systems | 9.1 TS1M0 | |
| Microsoft Windows Server 2003 Datacenter 64-bit Edition | 9.1 TS1M0 | |
| Microsoft Windows Server 2003 Enterprise 64-bit Edition | 9.1 TS1M0 | |
| Microsoft Windows 2000 Advanced Server | 9.1 TS1M0 | |
| Microsoft Windows 2000 Datacenter Server | 9.1 TS1M0 | |
| Microsoft Windows 2000 Server | 9.1 TS1M0 | |
| Microsoft Windows 2000 Professional | 9.1 TS1M0 | |
| Microsoft Windows NT Workstation | 9.1 TS1M0 | |
| Microsoft Windows Server 2003 Datacenter Edition | 9.1 TS1M0 | |
| Microsoft Windows Server 2003 Enterprise Edition | 9.1 TS1M0 | |
| Microsoft Windows Server 2003 Standard Edition | 9.1 TS1M0 | |
| Microsoft Windows XP Professional | 9.1 TS1M0 | |
| 64-bit Enabled AIX | 9.1 TS1M0 | |
| 64-bit Enabled HP-UX | 9.1 TS1M0 | |
| 64-bit Enabled Solaris | 9.1 TS1M0 | |
| HP-UX IPF | 9.1 TS1M0 | |
| Linux | 9.1 TS1M0 | |
| OpenVMS Alpha | 9.1 TS1M0 | |
| Tru64 UNIX | 9.1 TS1M0 | |


