Sample 25501: Use the NAME= option to produce multiple graphs with PROC GANNO
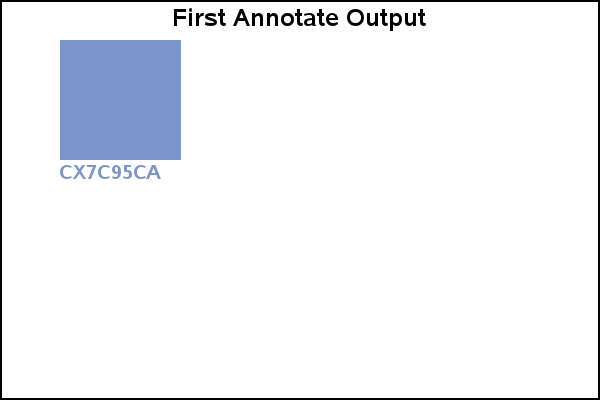
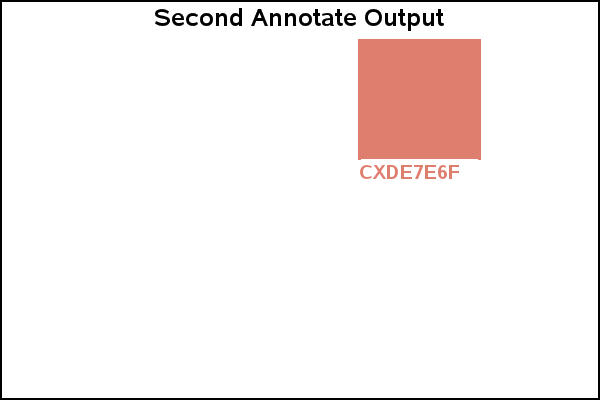
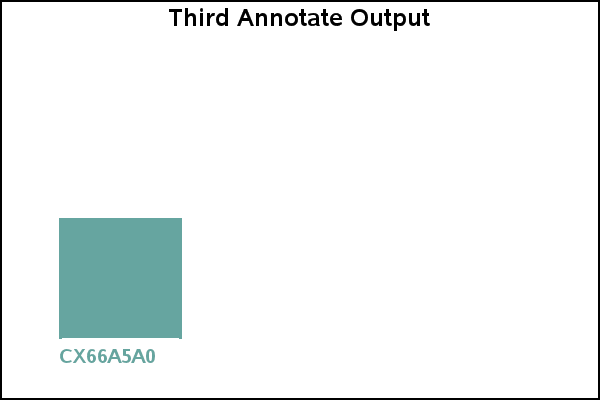
This sample uses the GANNO procedure and the NAME= option to generate multiple graphs from a single Annotate data set. Since NAME= is assigned the variable GRAFNAME, the GANNO procedure generates one graph for each unique value of GRAFNAME.
These sample files and code examples are provided by SAS Institute
Inc. "as is" without warranty of any kind, either express or implied, including
but not limited to the implied warranties of merchantability and fitness for a
particular purpose. Recipients acknowledge and agree that SAS Institute shall
not be liable for any damages whatsoever arising out of their use of this material.
In addition, SAS Institute will provide no support for the materials contained herein.
This sample uses the GANNO procedure and the NAME= option to generate multiple graphs from a single Annotate data set. Since NAME= is assigned the variable GRAFNAME, the GANNO procedure generates one graph for each unique value of GRAFNAME.
The graphics output in the Results tab was produced using SAS® 9.2. Submitting the sample code with releases of SAS prior to SAS 9.2 might produce different results.
 /* Set the graphics environment */
goptions reset=all cback=white border htitle=12pt htext=10pt;

 /* Create the Annotate data set */
data squares;
   length function color $ 8 text $ 25 style $ 25;
   xsys='3'; ysys='3';

   /* Name the first graph */
   grafname = 'graph1';

   /* Draw the first square */
   color='CX7C95CA';
   function='move'; x=10; y=60; output;
   function='bar';  x=30; y=90; style='solid'; output;

      /* Label the first square */
   function='label'; x=10; y=63; position='6';
      style="'Albany AMT/bold'"; size=2; text='CX7C95CA'; output;

           /* Write title */
      x=50; y=97; position='5'; size=2.5; color='black';
         style="'Albany AMT/bold'";
         text='First Annotate Output';
		 output;

      /* Draw a black frame */
   function='frame'; color='black'; when='b'; style='empty';
      output;

   /* Name the second graph */
   grafname = 'graph2';

      /* Draw the second square */
   color='CXDE7E6F'; style='solid';
   function='move'; x=60; y=60; output;
   function='bar';  x=80; y=90; output;

      /* Label the second square */
   function='label'; x=60; y=63; position='6';
      style="'Albany AMT/bold'"; size=2; text='CXDE7E6F'; output;

	  /* Write title */
      x=50; y=97; position='5'; size=2.5; color='black';
         style="'Albany AMT/bold'";
         text='Second Annotate Output';
		 output;

      /* Draw a black frame */
      function='frame'; color='black'; when='b'; style='empty';
      output;


     /* Name the third graph */
   grafname = 'graph3';

      /* Draw the third square */
   color='CX66A5A0'; style='solid';
   function='move'; x=10; y=15; output;
   function='bar';  x=30; y=45; output;

      /* Label the third square */
   function='label'; x=10; y=12; position='6';
      style="'Albany AMT/bold'"; ; size=2; text='CX66A5A0'; output;

	  /* Write title */
      x=50; y=97; position='5'; size=2.5; color='black';
         style="'Albany AMT/bold'";
         text='Third Annotate Output';
		 output;

      /* Draw a black frame */
      function='frame'; color='black'; when='b'; style='empty';
      output;
run;

   /* Generate annotate graphics */
proc ganno annotate=squares
           name=grafname
           description='Individual squares';
run;
quit;
These sample files and code examples are provided by SAS Institute
Inc. "as is" without warranty of any kind, either express or implied, including
but not limited to the implied warranties of merchantability and fitness for a
particular purpose. Recipients acknowledge and agree that SAS Institute shall
not be liable for any damages whatsoever arising out of their use of this material.
In addition, SAS Institute will provide no support for the materials contained herein.
This sample uses the GANNO procedure and the NAME= option to generate multiple graphs from a single Annotate data set. Since NAME= is assigned the variable GRAFNAME, the GANNO procedure generates one graph for each unique value of GRAFNAME.
| Date Modified: | 2005-07-20 03:02:43 |
| Date Created: | 2005-05-23 14:11:41 |
Operating System and Release Information
| SAS System | SAS/GRAPH | z/OS | 9.1 TS1M0 | |
| Microsoft® Windows® for 64-Bit Itanium-based Systems | 9.1 TS1M0 | |
| Microsoft Windows Server 2003 Datacenter 64-bit Edition | 9.1 TS1M0 | |
| Microsoft Windows Server 2003 Enterprise 64-bit Edition | 9.1 TS1M0 | |
| Microsoft Windows 2000 Advanced Server | 9.1 TS1M0 | |
| Microsoft Windows 2000 Datacenter Server | 9.1 TS1M0 | |
| Microsoft Windows 2000 Server | 9.1 TS1M0 | |
| Microsoft Windows 2000 Professional | 9.1 TS1M0 | |
| Microsoft Windows NT Workstation | 9.1 TS1M0 | |
| Microsoft Windows Server 2003 Datacenter Edition | 9.1 TS1M0 | |
| Microsoft Windows Server 2003 Enterprise Edition | 9.1 TS1M0 | |
| Microsoft Windows Server 2003 Standard Edition | 9.1 TS1M0 | |
| Microsoft Windows XP Professional | 9.1 TS1M0 | |
| 64-bit Enabled AIX | 9.1 TS1M0 | |
| 64-bit Enabled HP-UX | 9.1 TS1M0 | |
| 64-bit Enabled Solaris | 9.1 TS1M0 | |
| HP-UX IPF | 9.1 TS1M0 | |
| Linux | 9.1 TS1M0 | |
| OpenVMS Alpha | 9.1 TS1M0 | |
| Tru64 UNIX | 9.1 TS1M0 | |