Sample 24983: The MultNorm macro tests multivariate normality
 |  |  |  |  |
MultNorm macro to test multivariate normality
| Contents: | Purpose / History / Requirements / Usage / Details / Limitations / Missing Values / References |
- PURPOSE:
- The MultNorm macro provides tests and plots of multivariate normality, including the Mardia skewness and kurtosis tests, the Royston H test, the Henze-Zirkler test, and the Doornik-Hansen test. A test of univariate normality is also given for each of the variables. You can obtain a chi-square quantile-quantile plot of the observations' squared Mahalanobis distances, allowing a visual assessment of multivariate normality. Univariate histograms with overlaid normal curves are also available.
- HISTORY:
- The version of the MultNorm macro that you are using is displayed when you specify anything as the first argument. Here is an example:
%multnorm(v)
The MultNorm macro always attempts to check for a later version of itself. If it is unable to do this (such as if there is no active internet connection available), the macro issues the following message:
NOTE: Unable to check for newer version of MultNorm macro.The computations performed by the macro are not affected by the appearance of this message. However, you can avoid this check by specifying nochk as the first macro argument. This action can be useful if your machine has no connection to the internet.
Version Update Notes 2.0 Added the Royston and Doornik-Hansen tests. SAS/ETS® is no longer required or used to compute any test. var= is now optional. plot=mult is now the default. nochk is added. All tests are saved in data set _STATS. 1.4 SAS/IML® is no longer required if SAS/ETS PROC MODEL is not found. SAS/STAT® PROC PRINCOMP is required instead. Univariate plots, if requested, and tests are now presented first. High-resolution plotting is done by Base SAS® PROC SGPLOT if available, or by SAS/GRAPH® PROC GPLOT if not. It checks that the specified data set and variables exist. 1.3 Added a message showing whether MODEL or IML is selected. Added a check for error status after MODEL or IML. Errors terminate the macro. Added an automatic check for a newer version. Documented the difference between tests in PROC MODEL and PROC UNIVARIATE. 1.2 Use SAS/ETS PROC MODEL if available to get all tests, then SAS/IML, and then univariate only. Use ODS SELECT to obtain only the normal table from MODEL (requires SAS® 8 or later). Provide univariate histograms with overlaid normal curves and tests controlled by the expanded PLOT= parameter. 1.1 Use the PVALUE format. Prefix notes from macro with MULTNORM: instead of NOTE:. 1.0 Initial coding. - REQUIREMENTS:
- Only Base SAS is required for the univariate tests and histograms and for the Royston multivariate test. SAS/STAT is required for the Mardia, Henze-Zirkler, and Doornik-Hansen multivariate tests and for the multivariate chi-square plot.
- USAGE:
- Follow the instructions on the Downloads tab of this sample to save the MultNorm macro definition. Replace the text within quotes in the following statement with the location of the MultNorm macro definition file on your system. In your SAS program or in the SAS editor window, specify this statement to define the MultNorm macro and make it available for use:
%inc "<location of your file containing the MultNorm macro>";
Following this statement, you can call the MultNorm macro. See the Results tab for an example.
The options and allowable values are as follows:
- data=data-set-name
- SAS data set to be analyzed. If data= is not supplied, the most recently created SAS data set is used.
- var=variable-list
- The list of variables to use when testing for univariate and multivariate normality. Individual variable names, separated by blanks, must be specified. Special variable lists (such as VAR1-VAR10 or ABC--XYZ) cannot be used. If not specified, all numeric variables in the data= data set are used.
- plot=both | mult | uni | none
- plot=mult (the default) requests a chi-square quantile-quantile (Q-Q) plot of the squared Mahalanobis distances of the observations from the mean vector. plot=uni requests a univariate histogram for each variable with overlaid normal density curves and additional univariate tests of normality. plot=both requests both of the above. plot=none suppresses all plots and the additional univariate normality tests.
- hires=yes | no
- Ignored if plot=none. hires=yes (the default) requests that high-resolution graphics be used when creating plots. PROC SGPLOT is used by default but, if not found, SAS/GRAPH PROC GPLOT is used. If SAS/GRAPH PROC GPLOT is used, you must specify any needed graphics-related options before invoking the macro. hires=no requests that the multivariate plot be drawn with low-resolution using PROC PLOT. The univariate plots are not available with hires=no.
- DETAILS:
- In order for a set of variables to be distributed as multivariate normal, each variable must be normally distributed. When all individual variables are normally distributed, the set of variables might or might not be distributed as multivariate normal. Hence, testing each variable only for univariate normality is not a sufficient test of multivariate normality.
Univariate tests and plots
Univariate normality for each of the analysis variables specified in var= is assessed using the Shapiro-Wilk W test (for sample size 2000 or less) or the Kolmogorov-Smirnov test, depending on the sample size, as done in the UNIVARIATE procedure. Additional tests are provided if univariate plots are requested with plot=uni or plot=both. For details about the univariate tests of normality, see Goodness Of Fit Tests in the Details section of the PROC UNIVARIATE documentation.
If the p-value of any of the tests is small, then multivariate, as well as univariate, normality can be rejected. However, it is important to note that the univariate Shapiro-Wilk W test is very powerful and is capable of detecting trivially small departures from univariate normality as the sample size becomes large. This might cause you to reject univariate, and therefore multivariate, normality unnecessarily if the tests are being done to validate the use of methods that are robust to small departures from normality. For such situations, the plots are useful by providing a visual assessment of approximate normality.
Multivariate tests and plot
Four tests of multivariate normality are available in the MultNorm macro. Mardia (1974) proposed tests of multivariate normality based on sample measures of multivariate skewness and kurtosis. The Henze-Zirkler test of multivariate normality is based on a nonnegative function that measures the distance between two distribution functions and is used to assess the distance between the distribution function of the data and the multivariate normal distribution function. Royston (1983, 1992, 1993) introduced a multivariate test based on and extending the Shapiro-Wilk W test for univariate normality. The Doornik-Hansen test uses skewness and kurtosis to create an omnibus test of multivariate normality.
For all of the tests provided, a small p-value rejects the null hypothesis of multivariate normality.
All tests, except the Royston test, and the chi-square plot require the PRINCOMP procedure in SAS/STAT to compute principal component scores or the eigenvalues and eigenvectors of the correlation matrix of the original variables. When the correlation matrix for the data is singular or if PROC PRINCOMP is not available, then a message is printed in the log and only the Royston multivariate normality test is done.
Under the normal distribution, the expected multivariate skewness is p(p+2)[(n+1)(p+1)-6]/(n+1)(n+3) and the expected multivariate kurtosis is p(p+2)(n-1)/(n+1). MultNorm displays centered values (observed minus expected) of these statistics and a small p-value indicates significant deviation of the observed measure from expected under normality. Mardia's multivariate skewness statistic and p-value is computed using a small sample correction multiplier. Since the value of this correction diminishes to very near 1 beyond a sample size of about 100, it is always included. The uncentered skewness and kurtosis measures, their expected values under normality, and the uncorrected multivariate skewness statistic and its p-value are not included in the table displayed by the macro but are included in the output data set, _STATS.
Many tests for multivariate normality have been proposed, and while no single test has been found to be uniformly best, the three offered by the MultNorm macro are among the ones most often used. Farrell et al. (2007) found that the Type I error rate was well-preserved by both the Royston test and the Doornik-Hansen test over a wide range of sample sizes and number of variables. The Henze-Zirkler test also performs well in this regard for sample sizes above 75 and has good statistical power against alternative distributions, but is slightly conservative for smaller sample sizes. Royston's test exhibits good power for smaller sample sizes.
Chi-square Q-Q plot
For p variables and a large sample size, the squared Mahalanobis distances of the observations to the mean vector are distributed as chi-square with p degrees of freedom. However, the sample size must be quite large for the chi-square distribution to obtain unless p is very small. Also, this plot is sensitive to the presence of outliers. So, this plot should be cautiously used as a rough indicator of multivariate normality.
BY group processing
While the MultNorm macro does not directly support BY group processing, this capability can be provided by the RunBY macro that can run the MultNorm macro repeatedly for each of the BY groups in your data. See the RunBY macro documentation for details about its use. Also see the example titled "BY group processing" on the Results tab.
Output data set
The results of the univariate Shapiro-Wilk or Kolmogorov-Smirnov tests as well as any multivariate tests are saved in data set _STATS. If many variables are tested for univariate normality, the p-values in this data set could be adjusted for multiple testing be using it as input to the MULTTEST procedure.
- LIMITATIONS:
- The Doornik-Hansen test requires 8 or more observations. The Royston test is limited to sample sizes between 4 and 2,000 observations.
Memory and time requirements increase with both the sample size and number of variables. Data sets having thousands of observations and/or hundreds of variables might require excessive running time or memory.
- MISSING VALUES:
- Observations with missing values in any of the analysis variables are omitted from the analysis and plot.
- REFERENCES:
- Doornik, J.A. and Hansen, (2008), "An Omnibus Test for Univariate and Multivariate Normality," Oxford Bulletin of Economics and Statistics, 70(Supplement 1), 927-939.
Farrell, P.J., Salibian-Barrera, M. and Naczk, K. (2007), "On tests for multivariate normality and associated simulation studies," Journal of Statistical Computation & Simulation, Vol. 77(12), 1065-1080.
Henze, N. and Zirkler, B. (1990), "A Class of Invariant Consistent tests for Multivariate Normality," Communications in Statistics, Part A - Theory and Methods., 19(10), 3595-3617.
Mardia, K.V. (1974), "Applications of some measures of multivariate skewness and kurtosis in testing normality and robustness studies," Sankhya B, 36, 115-128.
Mardia, K.V. (1975), "Assessment of Multinormality and the Robustness of Hotelling's T-squared Test," Applied Statistics, 1975, 24(2), 163-171.
Mardia, K.V., Kent, J.T., and Bibby, J.M. (1979), Multivariate Analysis, New York: Academic Press.
Mardia, K.V. (1980), "Measures of Multivariate Skewness and Kurtosis with Applications," Biometrika, 57(3), 519-530.
Royston, J.P. (1982), "An Extension of Shapiro and Wilk's W Test for Normality to Large Samples," Applied Statistics, 31, 115-124.
Royston, J.P. (1983), "Techniques for Assessing Multivarate Normality Based on the Shapiro-Wilk W," Journal of the Royal Statistical Society, Series C (Applied Statistics), Vol. 32(2), 121-133.
Royston, J.P. (1992), "Approximating the Shapiro-Wilk W-Test for Non-normality," Statistics and Computing, 2, 117-119.
Royston, J.P. (1993), "A Toolkit for Testing for Non-Normality in Complete and Censored Samples," Journal of the Royal Statistical Society, Series D (The Statistician, Vol. 42(1), 37-43.
Shapiro, S.S. and Wilk, M.B. (1965), "An Analysis of Variance Test for Normality (complete samples)," Biometrika, 52, 591-611.
Svantesson, T. and Wallace, J.W. (2003), "Tests for assessing multivariate normality and the covariance structure of MIMO data," Proceedings of the 2003 IEEE International Conference on Acoustics, Speech, and Signal Processing.
These sample files and code examples are provided by SAS Institute Inc. "as is" without warranty of any kind, either express or implied, including but not limited to the implied warranties of merchantability and fitness for a particular purpose. Recipients acknowledge and agree that SAS Institute shall not be liable for any damages whatsoever arising out of their use of this material. In addition, SAS Institute will provide no support for the materials contained herein.
These sample files and code examples are provided by SAS Institute Inc. "as is" without warranty of any kind, either express or implied, including but not limited to the implied warranties of merchantability and fitness for a particular purpose. Recipients acknowledge and agree that SAS Institute shall not be liable for any damages whatsoever arising out of their use of this material. In addition, SAS Institute will provide no support for the materials contained herein.
- EXAMPLE 1:
-
The following example is from Mardia et al. (1979). The multivariate skewness test statistic differs due to the use in MultNorm of an alternative approximation to the chi-square distribution given in Mardia (1974).
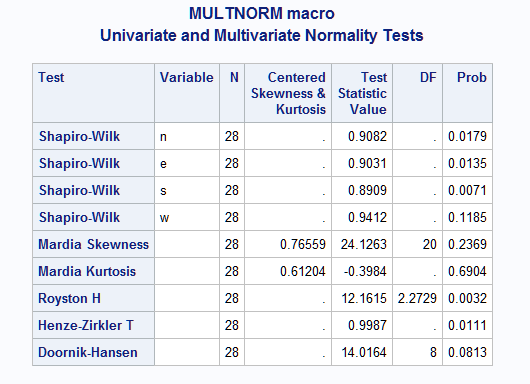
         data cork;
           input n e s w @@;
           datalines;
         72 66 76 77   91 79 100 75
         60 53 66 63   56 68 47 50
         56 57 64 58   79 65 70 61
         41 29 36 38   81 80 68 58
         32 32 35 36   78 55 67 60
         30 35 34 26   46 38 37 38
         39 39 31 27   39 35 34 37
         42 43 31 25   32 30 30 32
         37 40 31 25   60 50 67 54
         33 29 27 36   35 37 48 39
         32 30 34 28   39 36 39 31
         63 45 74 63   50 34 37 40
         54 46 60 52   43 37 39 50
         47 51 52 43   48 54 57 43
         ;

         %inc "<location of your file containing the MultNorm macro>";
         %multnorm(data=cork)
Below are the results from the above example. The first rows in the results display the univariate tests of normality, including the name of the test (Shapiro-Wilk or Kolmogorov-Smirnov) that was used, the variable name, the values of the test statistic, and the corresponding p-values. The next two lines display Mardia's tests of multivariate normality based on skewness or kurtosis. The "Centered Skewness & Kurtosis" column shows the deviations of the multivariate skewness and kurtosis from the values expected under the multivariate normal distribution. Larger deviations suggest nonnormality. The tests of multivariate normality based on these statistics as well as the Royston, Henze-Zirkler, and Doornik-Hansen tests are displayed including their test statistics and p-values. For all tests, univariate and multivariate, small p-values indicate nonnormality. Tests, as well as plots, of univariate normality for each variable can also be provided by specifying plot=uni or plot=both. See the Usage section on the Details tab for more information about these tests.
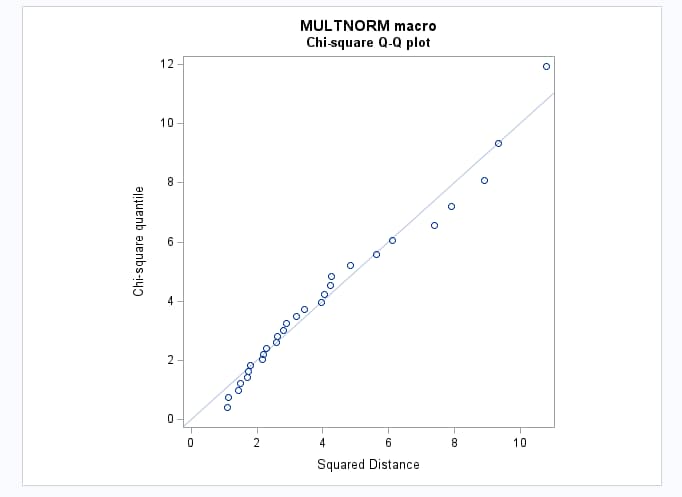
The chi-square quantile-quantile plot plots the squared Mahalanobis distances against the corresponding quantiles of the limiting chi-square distribution. If the data are distributed as multivariate normal, then the points should fall close to the diagonal line with slope one and intercept zero. Plots of the individual variables can also be displayed if plot=uni or plot=both is specified. See the Usage section in the Details tab for more information.
In the results displayed below, the Mardia tests do not reject multivariate normality. Note the deviations of skewness and kurtosis from normal are small. However, the Royston and Henze-Zirkler multivariate tests suggest nonnormality. The Doornik-Hansen test is marginal. Also, at least one of the univariate tests rejects univariate normality and therefore multivariate normality. The multivariate plot seems to indicate approximate normality, but the sample is quite small.
- EXAMPLE 2: BY group processing
- While the MultNorm macro does not support BY processing directly, the RunBY macro can be used to run the macro on BY
groups in the data. In the statements below, the Iris data set (available in the SASHELP library) is analyzed. The Iris data set contains measures on
four variables for each of the three species. The RunBY macro is then used to run the MultNorm macro on each species in turn (results not shown). This is done with a DATA
step that includes a subsetting WHERE statement that specifies the special macro variables, _BYx and _LVLx, which are used by the RunBY macro to process
each BY group. The BYlabel macro variable is also used to label the displayed results with the BY group definition. Since the MultNorm macro writes its
own titles, a FOOTNOTE statement is used instead of a TITLE statement to provide the label.
     %macro code;
        data subset; sashelp.iris; where &_BY1=&_LVL1; run;
        footnote "Above for &BYlabel";
        %multnorm(data=subset, var=SepalLength SepalWidth PetalLength PetalWidth, plot=none)
        footnote;
     %mend;
     %RunBY(data=sashelp.iris, by=species)
Right-click the link below and select Save to save the MultNorm macro definition to a file. It is recommended that you name the file
multnorm.sas.
Download and save multnorm.sas
| Type: | Sample |
| Topic: | Analytics ==> Exploratory Data Analysis Analytics ==> Multivariate Analysis Analytics ==> Descriptive Statistics SAS Reference ==> Macro Analytics ==> Analysis of Variance |
| Date Modified: | 2022-08-24 10:20:37 |
| Date Created: | 2005-01-13 15:02:42 |
Operating System and Release Information
| Product Family | Product | Host | SAS Release | |
| Starting | Ending | |||
| SAS System | SAS/STAT | All | n/a | n/a |