Sample 24945: Replay graphs with a common title and legend with PROC GREPLAY
 |  |  |  |  |
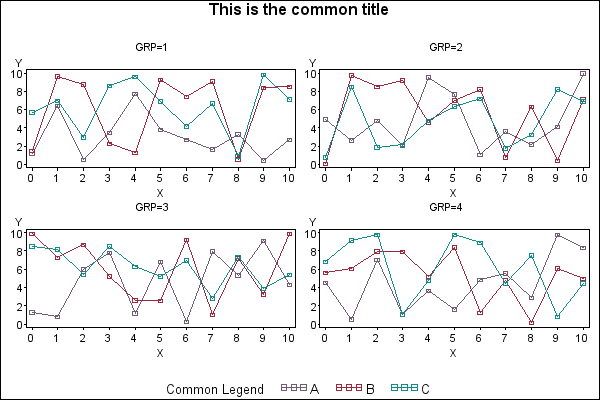
This sample program uses PROC GREPLAY to replay multiple graphs onto a single a page with a common title and legend.
These sample files and code examples are provided by SAS Institute Inc. "as is" without warranty of any kind, either express or implied, including but not limited to the implied warranties of merchantability and fitness for a particular purpose. Recipients acknowledge and agree that SAS Institute shall not be liable for any damages whatsoever arising out of their use of this material. In addition, SAS Institute will provide no support for the materials contained herein.
This sample program uses PROC GREPLAY to replay multiple graphs onto a single a page with a common title and legend.
The graphics output in the Results tab was produced using SAS® 9.2. Submitting the sample code with releases of SAS prior to SAS 9.2 might produce different results.
 /* Set the graphics environment */
goptions reset=goptions cback=white border htitle=12pt htext=10pt;

 /* Delete all of the old graphs from WORK.GSEG */
 /* if necessary.                               */
proc greplay nofs igout=work.gseg;
   delete _all_;
run;
quit;

 /* Create a sample data set */
data one;
   do GRP=1 to 4;
      do Z='A','B','C';
         do X=0 to 10;
            Y=ranuni(0)*10;
            output;
         end;
      end;
   end;
run;

 /* Sort the data set by GRP and Z */
proc sort;
   by grp z;
run;

 /* Define SYMBOL statements */
symbol1 v=square c=grp   i=join h=1.5;
symbol2 v=square c=depk  i=join h=1.5;
symbol3 v=square c=vibg  i=join h=1.5;

 /* Customize the axes */
axis1 order=(0 to 10 by 2) offset=(2,2)pct
      minor=none;
axis2 order=(0 to 10 by 1) offset=(2,2)pct
      minor=none;

 /* Use the NODISPLAY graphics option */
goptions nodisplay;

title1;

 /* Use a BY statement to produce the four separate graphs */
proc gplot;
   plot y*x=z / vaxis=axis1 haxis=axis2 nolegend frame;
   by grp;
run;
quit;

 /* Specify the order so that all observations will be out of range */
axis3 order=(-99 to -90 by 1);

 /* Specify LEGEND statement to be used by the following GPLOT */
legend1 label=('Common Legend');

 /* Produce a fifth graph that generates only a legend */
proc gplot;
  plot y*x=z / vaxis=axis3 haxis=axis3 noaxes
               legend=legend1 noframe;
run;
quit;

/* Create a common shared title */
proc gslide;
   title1 'This is the common title';
run;
quit;

 /* Turn the DISPLAY option on */
goptions display;

 /* Create 5 panel template.    */
 /* Replay entries into panels. */
proc greplay nofs igout=work.gseg tc=tempcat;
   tdef spec des='five panel template'
   1/ llx=1       lly=50
      ulx=1       uly=90
      urx=50      ury=90
      lrx=50      lry=50 color=white
   2/ llx=50      lly=50
      ulx=50      uly=90
      urx=99      ury=90
      lrx=99      lry=50 color=white
   3/ llx=1       lly=10
      ulx=1       uly=50
      urx=50      ury=50
      lrx=50      lry=10 color=white
   4/ llx=50      lly=10
      ulx=50      uly=50
      urx=99      ury=50
      lrx=99      lry=10 color=white
   5/ llx=0       lly=0
      ulx=0       uly=100
      urx=100     ury=100
      lrx=100     lry=0
   ;

   template spec;
   treplay 1:gplot 2:gplot1 3:gplot2 4:gplot3 5:gplot4 5:gslide;
run;
quit;
These sample files and code examples are provided by SAS Institute Inc. "as is" without warranty of any kind, either express or implied, including but not limited to the implied warranties of merchantability and fitness for a particular purpose. Recipients acknowledge and agree that SAS Institute shall not be liable for any damages whatsoever arising out of their use of this material. In addition, SAS Institute will provide no support for the materials contained herein.
This sample program uses PROC GREPLAY to replay multiple graphs onto a single a page with a common title and legend.
| Type: | Sample |
| Topic: | SAS Reference ==> Procedures ==> GREPLAY |
| Date Modified: | 2005-09-01 03:03:08 |
| Date Created: | 2004-11-11 11:08:05 |
Operating System and Release Information
| Product Family | Product | Host | SAS Release | |
| Starting | Ending | |||
| SAS System | SAS/GRAPH | All | n/a | n/a |