Sample 24939: Dynamically define template panels
These sample files and code examples are provided by SAS Institute
Inc. "as is" without warranty of any kind, either express or implied, including
but not limited to the implied warranties of merchantability and fitness for a
particular purpose. Recipients acknowledge and agree that SAS Institute shall
not be liable for any damages whatsoever arising out of their use of this material.
In addition, SAS Institute will provide no support for the materials contained herein.
/***************************************************************/
/* The purpose of this program is to create a template and */
/* replay entries based upon the values of the ACROSS and DOWN */
/* variables. */
/***************************************************************/
goptions reset=all;
/* Resolved values for used macro variables display in SASLOG */
options mprint macrogen symbolgen;
/* Specify device driver and suppress byline */
goptions dev=ps hby=0;
/* Specify macro variables containing the number of */
/* template panels across and down, and then calculate */
/* the total number of panels. */
%let across=3;
%let down=2;
%let npanels=%eval(&down*&across);
/* Delete entries in WORK.GSEG catalog */
proc greplay nofs igout=work.gseg;
delete _all_;
run;
quit;
/* Use DSGI determine default HSIZE and VSIZE for the device. */
/* Then divide HSIZE and VSIZE by the number of panels across */
/* and down to calculate the size of each panel */
data garea;
rc=ginit(); /* Initialize DSGI */
call gask('hsize',hsize,rc); /* Get default HSIZE for driver */
hsze=hsize/&across; /* Calculate horiz panel size */
call symput('hsize',left(trim(hsze))); /* Create HSIZE macro var */
call gask('vsize',vsize,rc); /* Get default VSIZE for driver */
vsze=vsize/&down; /* Calculate vert panel size */
call symput('vsize',left(trim(vsze))); /* Create VSIZE macro var */
rc=gterm(); /* Terminate DSGI */
run;
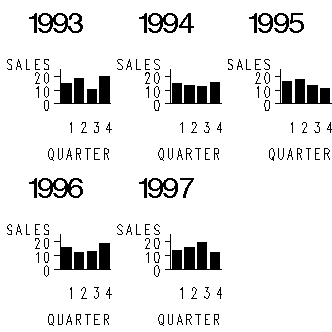
/* Generate some data to graph. In our example, we will produce */
/* a separate chart for each year between 1980 and 1991. */
data one;
do year=1993 to 1997;
do quarter=1 to 4;
sales=10+(10*uniform(5555));
output;
end;
end;
run;
/* Specify VSIZE and HSIZE options to reflect the size of template */
/* panels and suppress display of graphs while being generated */
goptions nodisplay hsize=&hsize vsize=&vsize;
/* Create the charts */
proc gchart data=one;
vbar quarter /discrete sumvar=sales raxis=axis1;
by year;
pattern1 v=solid c=black;
title "#byval(year)";
axis1 order=0 to 20 by 10 label=('SALES') minor=none;
run;
quit;
/* Use DSGI and DATA step to calculate values to enable us to */
/* create template panels and replay graphs. */
data numgraf;
rc=gset('catalog','work','gseg'); /* Open the WORK.GSEG catalog */
rc=ginit();
call gask('numgraph',grsegcnt,rc); /* Get number of graphs in catalog */
if grsegcnt<&npanels then num=grsegcnt; /* If there are more graphs than */
else num=&npanels; /* panels, replay only as many graphs */
/* as there are panels. */
call symput('numgrph',left(trim(num))); /* Number of graphs to replay */
ymult=100/&down; /* Calculate Y increment for panels */
xmult=100/&across; /* Calculate X increment for panels */
rc=gterm(); /* Terminate DSGI */
run;
/* Calculate the panel coordinates */
data coord;
set numgraf;
do x=0 to (100-xmult) by xmult; /* Calculate the X coordinate values */
llx=x;
ulx=x;
urx=x+xmult;
lrx=x+xmult;
do y=0 to (100-ymult) by ymult; /* Calculate the Y coordinate values */
lly=y;
uly=y+ymult;
ury=y+ymult;
lry=y;
output;
end;
end;
run;
proc sort;
by descending y;
run;
/* Create macro variables that resolve to panel coordinates */
data mccoord;
set coord end=eof;
call symput('llx'||left(_n_),llx);
call symput('ulx'||left(_n_),ulx);
call symput('urx'||left(_n_),urx);
call symput('lrx'||left(_n_),lrx);
call symput('lly'||left(_n_),lly);
call symput('uly'||left(_n_),uly);
call symput('ury'||left(_n_),ury);
call symput('lry'||left(_n_),lry);
if eof then call symput('total',_n_);
run;
/* Macro TEMPDEF will be called from TDEF statement within a */
/* loop to create template. */
%macro tempdef;
%do i=1 %to &total;
&i / llx=&&llx&i lly=&&lly&i
ulx=&&ulx&i uly=&&uly&i
urx=&&urx&i ury=&&ury&i
lrx=&&lrx&i lry=&&lry&i
%end;
%mend tempdef;
/* Macro TPLAY will be called from TREPLAY statement to */
/* replay entries into template. */
%macro tplay;
%do i=1 %to &numgrph;
&i:&i
%end;
%mend tplay;
/* Reset previous GOPTIONS and specify TARGET=PS. */
/* Specify TARGET=PS to display template entry to screen. */
goptions reset=goptions target=ps;
proc greplay nofs igout=work.gseg tc=work.templt;
tdef spec&npanels
%tempdef; /* Invoke macro TEMPDEF to create template */
template spec&npanels;
treplay
%tplay; /* Invoke macro TPLAY to replay graphs */
run;
quit;
These sample files and code examples are provided by SAS Institute
Inc. "as is" without warranty of any kind, either express or implied, including
but not limited to the implied warranties of merchantability and fitness for a
particular purpose. Recipients acknowledge and agree that SAS Institute shall
not be liable for any damages whatsoever arising out of their use of this material.
In addition, SAS Institute will provide no support for the materials contained herein.
This sample program replays entries based upon the values of the ACROSS and DOWN variables.
| Type: | Sample |
| Topic: | SAS Reference ==> Procedures ==> GREPLAY
|
| Date Modified: | 2005-08-31 03:03:23 |
| Date Created: | 2004-11-11 11:08:04 |
Operating System and Release Information
| SAS System | SAS/GRAPH | All | n/a | n/a |


