Sample 24935: Create a shadow behind a needle plot with PROC GPLOT
This sample uses a dummy Y variable to draw a thick plot line with PROC GPLOT that appears to be a vertical bar raised off of the background, which creates a shadow effect.
These sample files and code examples are provided by SAS Institute
Inc. "as is" without warranty of any kind, either express or implied, including
but not limited to the implied warranties of merchantability and fitness for a
particular purpose. Recipients acknowledge and agree that SAS Institute shall
not be liable for any damages whatsoever arising out of their use of this material.
In addition, SAS Institute will provide no support for the materials contained herein.
This sample uses a dummy Y variable to draw a thick plot line with PROC GPLOT that appears to be a vertical bar raised off of the background, which creates a shadow effect.
The graphics output in the Results tab was produced using SAS® 9.2. Submitting the sample code with releases of SAS prior to SAS 9.2 might produce different results.
 /* Set the graphics environment */
goptions reset=all cback=white border htitle=12pt htext=10pt;

data a;
   input Xvar Yvar Zvar;
   datalines;
1 10 2
2 20 2
3 27 2
4 42 2
5 50 2
6 40 2
7 36 2
8 55 2
9 75 2
;
run;

 /* This data step creates a dummy Y variable.  The offset that is     */
 /* used will vary dramatically based on the original Y variable       */
 /* value.  The data step also offsets the midpoint variable to        */
 /* give the graph the shadow effect. The midpoint variable values     */
 /* will also vary dramatically based on the midpoint axis data range. */
data b;
   set a;
   yvar = yvar - 1;
   xvar = xvar + .2;
   zvar = 1;
run;

data combine;
   set a b;
run;

axis1 order=(0 to 10 by 1)   offset=(0,0) minor=none;
axis2 order=(0 to 100 by 20) offset=(0,0) minor=none;

 /* The widths used on the SYMBOL statements will vary dramatically */
 /* based on the device used to display and/or print the graph.     */
symbol1 i=needle v=none c=black w=40;
symbol2 i=needle v=none c=vibg  w=40;

title1 'Creating a Shadow Plot';

proc gplot data=combine;
   plot yvar*xvar=zvar / lvref=1 cvref=black autovref
                         haxis=axis1 vaxis=axis2
                         cframe=beige nolegend;

  /* Uncomment the following NOTE statement if you want */
  /* to add text to the graph that also has a shadow    */
  /* effect.   */

  /*
  note h=3 c=black  j=center move=(31,83)pct 'Shadow Plot'
       h=3 c=vibg   j=center move=(30,84)pct 'Shadow Plot';
  */
run;
quit;
These sample files and code examples are provided by SAS Institute
Inc. "as is" without warranty of any kind, either express or implied, including
but not limited to the implied warranties of merchantability and fitness for a
particular purpose. Recipients acknowledge and agree that SAS Institute shall
not be liable for any damages whatsoever arising out of their use of this material.
In addition, SAS Institute will provide no support for the materials contained herein.
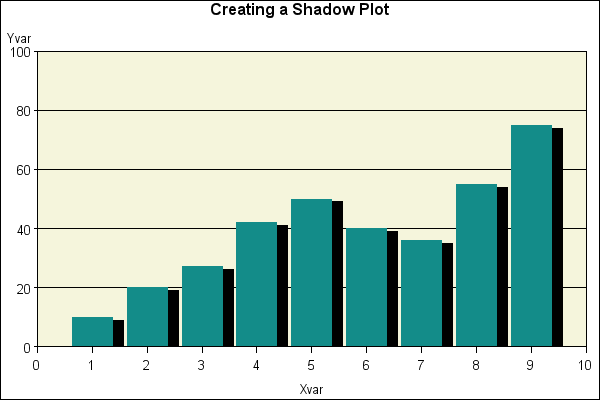
This sample uses a dummy Y variable to draw a thick plot line with PROC GPLOT that appears to be a vertical bar raised off of the background, which creates a shadow effect.
| Type: | Sample |
| Topic: | SAS Reference ==> Procedures ==> GPLOT
Query and Reporting ==> Creating Reports ==> Graphical ==> Graph Elements ==> Symbols/Interpolation
Query and Reporting ==> Creating Reports ==> Graphical ==> Graph Types ==> Plots ==> Other Plots
|
| Date Modified: | 2005-08-31 03:03:22 |
| Date Created: | 2004-11-11 11:08:03 |
Operating System and Release Information
| SAS System | SAS/GRAPH | All | n/a | n/a |


