Sample 24932: Display the left and right axes with a single combined legend with PROC GPLOT
 |  |  |  |  |
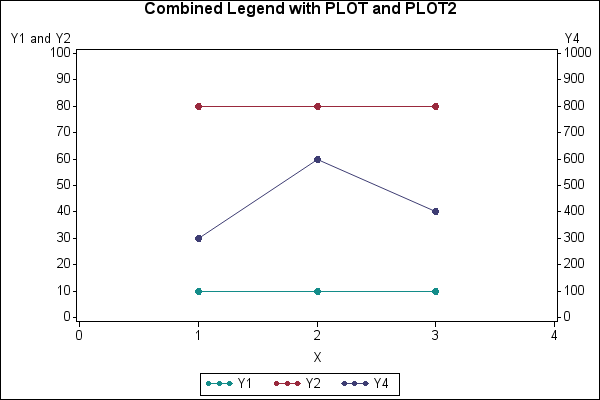
To produce a single combined legend, the SYMBOL3 and SYMBOL4 statements in the sample code are identical. While the third entry in the legend actually represents the new dummy variable added to the data set, the use of a LEGEND statement makes it appear as though the third legend entry represents the variable plotted by the PLOT2 statement.
These sample files and code examples are provided by SAS Institute Inc. "as is" without warranty of any kind, either express or implied, including but not limited to the implied warranties of merchantability and fitness for a particular purpose. Recipients acknowledge and agree that SAS Institute shall not be liable for any damages whatsoever arising out of their use of this material. In addition, SAS Institute will provide no support for the materials contained herein.
To produce a single combined legend, the SYMBOL3 and SYMBOL4 statements in the sample code are identical. While the third entry in the legend actually represents the new dummy variable added to the data set, the use of a LEGEND statement makes it appear as though the third legend entry represents the variable plotted by the PLOT2 statement.
The graphics output in the Results tab was produced using SAS® 9.2. Submitting the sample code with releases of SAS prior to SAS 9.2 might produce different results.
/* Set the graphics environment */
goptions reset=all cback=white border htitle=12pt htext=10pt;

/* Create the input data set A where Y3 is a    */
/* dummy variable containing all missing values */
data a;
   input X Y1 Y2 Y3 Y4;
   datalines;
1  10  80 . 300
2  10  80 . 600
3  10  80 . 400
;
run;

/* Define the title */
title1 'Combined Legend with PLOT and PLOT2';

/* Create symbol definitions where SYMBOL3 */
/* and SYMBOL4 are identical.              */
symbol1 interpol=join value=dot color=vibg width=1 height=1.5;
symbol2 interpol=join value=dot color=depk width=1 height=1.5;
symbol3 interpol=join value=dot color=mob  width=1 height=1.5;
symbol4 interpol=join value=dot color=mob  width=1 height=1.5;

/* Define axis characteristics */
axis1 order=(0 to 4 by 1) minor=none;
axis2 order=(0 to 100 by 10) minor=none
      label=('Y1 and Y2');
axis3 order=(0 to 1000 by 100) minor=none;

/* Customize the legend to make the third entry */
/* appear as though it represents variable Y4   */
/* plotted by the PLOT2 statement.              */
legend1 value=(tick=3 'Y4') label=none frame;

/* Create the graph */
proc gplot data=a;
  plot  y1*x=1 y2*x=2 y3*x=3 / overlay
                               legend=legend1
                               haxis=axis1
                               vaxis=axis2;
  plot2 y4*x=4 / vaxis=axis3;
run;
quit;
These sample files and code examples are provided by SAS Institute Inc. "as is" without warranty of any kind, either express or implied, including but not limited to the implied warranties of merchantability and fitness for a particular purpose. Recipients acknowledge and agree that SAS Institute shall not be liable for any damages whatsoever arising out of their use of this material. In addition, SAS Institute will provide no support for the materials contained herein.
| Type: | Sample |
| Topic: | SAS Reference ==> Procedures ==> GPLOT Query and Reporting ==> Creating Reports ==> Graphical ==> Graph Types ==> Plots ==> Line |
| Date Modified: | 2005-08-31 03:03:20 |
| Date Created: | 2004-11-11 11:08:02 |
Operating System and Release Information
| Product Family | Product | Host | SAS Release | |
| Starting | Ending | |||
| SAS System | SAS/GRAPH | All | n/a | n/a |