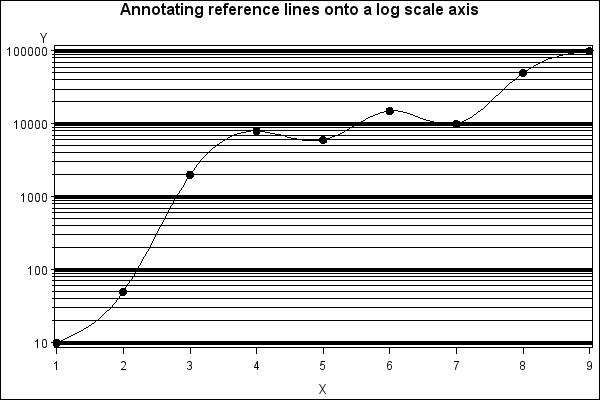
Sample 24926: Overlay reference lines on a log scale axis
This sample uses PROC GPLOT with the Annotate facilty to overlay reference lines at all major and minor tick marks on a log scale axis.
These sample files and code examples are provided by SAS Institute
Inc. "as is" without warranty of any kind, either express or implied, including
but not limited to the implied warranties of merchantability and fitness for a
particular purpose. Recipients acknowledge and agree that SAS Institute shall
not be liable for any damages whatsoever arising out of their use of this material.
In addition, SAS Institute will provide no support for the materials contained herein.
This sample uses PROC GPLOT with the Annotate facilty to overlay reference lines at all major and minor tick marks on a log scale axis.
The graphics output in the Results tab was produced using SAS® 9.2. Submitting the sample code with releases of SAS prior to SAS 9.2 might produce different results.
 /* Set the graphics environment */
goptions reset=all cback=white border htitle=12pt;

%let max=100000;

data one;
   input X Y;
   datalines;
1 10
2 50
3 2000
4 8000
5 6000
6 15000
7 10000
8 50000
9 100000
;
run;

 /* Create the annotate data set ANNO which is  */
 /* then used with PROC GPLOT to add horizontal */
 /* reference lines to the log scale axis.      */
data anno;
   retain xsys '1' ysys '2' color 'black' line 1;
   do i=1 to 4;
      cnt=0;
      do yvar=10**i to 10**(i+1) by 10**i;
         if (cnt=0 or yvar=&max) then size=3;
         else size=1;
         function='move'; x=0;   y=yvar;  output;
         function='draw'; x=100; y=yvar;  output;
         cnt+1;
      end;
   end;
run;

symbol1 interpol=spline value=dot width=1 height=1.3 color=black repeat=6;

 /* Define the vertical axis as a log scale axis */
axis1 logbase=10 logstyle=expand;
axis2 minor=none;

title1 'Annotating reference lines onto a log scale axis';

 /* Create the graph using the ANNO option */
 /* on the PLOT statement.                 */
proc gplot data=one;
   plot y*x / vaxis=axis1 haxis=axis2 anno=anno;
run;
quit;
These sample files and code examples are provided by SAS Institute
Inc. "as is" without warranty of any kind, either express or implied, including
but not limited to the implied warranties of merchantability and fitness for a
particular purpose. Recipients acknowledge and agree that SAS Institute shall
not be liable for any damages whatsoever arising out of their use of this material.
In addition, SAS Institute will provide no support for the materials contained herein.
This sample uses PROC GPLOT with the Annotate facilty to overlay reference lines at all major and minor tick marks on a log scale axis.
| Type: | Sample |
| Topic: | SAS Reference ==> Procedures ==> GPLOT
Query and Reporting ==> Creating Reports ==> Graphical ==> Graph Elements ==> Annotation
Query and Reporting ==> Creating Reports ==> Graphical ==> Graph Types ==> Plots ==> Other Plots
|
| Date Modified: | 2005-08-31 03:03:19 |
| Date Created: | 2004-11-11 11:08:01 |
Operating System and Release Information
| SAS System | SAS/GRAPH | All | n/a | n/a |


