Sample 24922: Change the mean symbol on a HILO plot with PROC GPLOT
This sample program uses PROC GPLOT to overlay a dummy symbol to block out the default tick mark at the mean, and then puts a new symbol over the blanked out default symbol. This code uses PROC MEANS to calculate the mean Y value for each X value.
These sample files and code examples are provided by SAS Institute
Inc. "as is" without warranty of any kind, either express or implied, including
but not limited to the implied warranties of merchantability and fitness for a
particular purpose. Recipients acknowledge and agree that SAS Institute shall
not be liable for any damages whatsoever arising out of their use of this material.
In addition, SAS Institute will provide no support for the materials contained herein.
This sample program uses PROC GPLOT to overlay a dummy symbol to block out the default tick mark at the mean, and then puts a new symbol over the blanked out default symbol. This code uses PROC MEANS to calculate the mean Y value for each X value.
The graphics output in the Results tab was produced using SAS® 9.2. Submitting the sample code with releases of SAS prior to SAS 9.2 might produce different results.
 /* Set the graphics environment */
goptions reset=all cback=white border htitle=12pt htext=10pt;

data a;
   input X Y;
   datalines;
1 45
1 73
2 49
2 75
3 52
3 60
4 39
4 62
5 50
5 72
;
run;

 /* Use PROC MEANS to calculate the mean for */
 /* each unique value of X.                  */
proc means data=a;
  by x;
  output out=meandata mean=means;
run;

data b;
  merge a meandata;
  by x;
run;

 /* Create the symbol definitions */
symbol1 i=hiloj v=dot    c=vibg  h=1.3;
symbol2 i=none  v=dot    c=white h=1.3;
symbol3 i=none  v=circle c=depk  h=1.3;

axis1 offset=(2,2) minor=none;

title1 'Change the Mean Symbol on a HILO Plot';
footnote1 angle=90 '   ';

 /* Create the graph */
proc gplot data=b;
  plot y*x means*x means*x / overlay haxis=axis1
                             vaxis=axis1;
run;
quit;
These sample files and code examples are provided by SAS Institute
Inc. "as is" without warranty of any kind, either express or implied, including
but not limited to the implied warranties of merchantability and fitness for a
particular purpose. Recipients acknowledge and agree that SAS Institute shall
not be liable for any damages whatsoever arising out of their use of this material.
In addition, SAS Institute will provide no support for the materials contained herein.
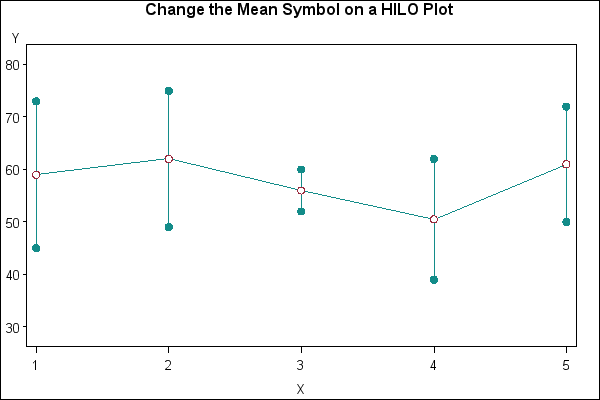
This sample program uses PROC GPLOT to overlay a dummy symbol to block out the default tick mark at the mean, and then puts a new symbol over the blanked out default symbol.
| Type: | Sample |
| Topic: | SAS Reference ==> Procedures ==> GPLOT
Query and Reporting ==> Creating Reports ==> Graphical ==> Graph Elements ==> Symbols/Interpolation
Query and Reporting ==> Creating Reports ==> Graphical ==> Graph Types ==> Plots ==> Other Plots
|
| Date Modified: | 2005-08-31 03:03:18 |
| Date Created: | 2004-11-11 11:08:01 |
Operating System and Release Information
| SAS System | SAS/GRAPH | All | n/a | n/a |


