Sample 24920: Label data points in a two-dimensional plot using PROC GPLOT and Annotate
 |  |  |  |  |
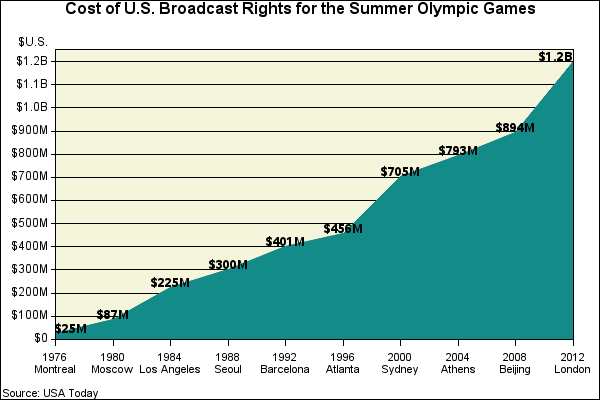
The sample code on the Full Code tab uses PROC GPLOT together with the Annotate facility to label data points in a two-dimensional plot.
These sample files and code examples are provided by SAS Institute Inc. "as is" without warranty of any kind, either express or implied, including but not limited to the implied warranties of merchantability and fitness for a particular purpose. Recipients acknowledge and agree that SAS Institute shall not be liable for any damages whatsoever arising out of their use of this material. In addition, SAS Institute will provide no support for the materials contained herein.
The sample code below uses PROC GPLOT together with the Annotate facility to label data points in a two-dimensional plot.
The graphics output in the Results tab was produced using SAS® 9.2. Submitting the sample code with releases of SAS prior to SAS 9.2 might produce different results.
/* Set the graphics environment */
goptions reset=all border cback=white htext=9pt htitle=12pt;

 /* Create the input data set, GAMES. GAMES contains the   */
 /* cities in which the events were held from 1976 through */
 /* 2012 and the cost of the broadcast rights.             */
data games;
   input Place $ 1-16 Cost;
   datalines;
1976*Montreal      25
1980*Moscow        87
1984*Los Angeles  225
1988*Seoul        300
1992*Barcelona    401
1996*Atlanta      456
2000*Sydney       705
2004*Athens       793
2008*Beijing      894
2012*London      1200
;
run;

 /* Create a format for the values of COST.  The AMTFMT. */
 /* format adds an 'M' or a 'B' to the values  and       */
 /* prefixes the values with a dollar sign ($).          */
proc format;
   picture amtfmt low-999='009M' (prefix='$')
                  1000-high='09.9B' (prefix='$' mult=.01);
run;

 /* Create an annotate data set to label the costs */
data labels;
   length function color text $ 8 style $ 25;
   retain function 'label' xsys ysys '2' hsys 'D'
          size 10 when 'a' color 'black';
   drop place cost;
   set games end=lastob;

   /* The PLACE and COST variables from GAMES determine   */
   /* the values of the XC and Y variables.  XC is used   */
   /* instead of X because PLACE is a character variable. */
   xc=place; y=cost;

   style="'Albany AMT/bold'";

   /* The formatted values of COST are */
   /* displayed as the text.           */
   text=left(put(cost,amtfmt.));

   /* The value of POSITION changes, depending on */
   /* the data point's location on the plot line. */
   if _n_=1 then position='C';
   else if lastob then position='A';
   else position='B';
   output;
run;

 /* Add a title to the graph */
title1 'Cost of U.S. Broadcast Rights for the Summer Olympic Games';

 /* The VALUE= options in the AXIS1 statement stacks the tick mark */
 /* labels by adding JUSTIFY=CENTER between the text strings.         */
axis1 label=none split='*' offset=(0,0) value=(height=8pt);
axis2 label=('$U.S.')
      order=(0 to 1200 by 100)
      offset=(0,3)pct value=(tick=1 '$0');

/* Define the pattern for the area in the plot. */
pattern1 color=vibg value=solid;
symbol1  color=vibg value=none interpol=join;

 /* Produce the plot. */
proc gplot data=games;
   plot cost*place / areas=1 haxis=axis1 vaxis=axis2
                     autovref chref=black
                     cvref=black vminor=0
                     annotate=labels cframe=beige;
  format cost amtfmt.;
  footnote1 j=l h=8pt " Source: USA Today";
run;
quit;
These sample files and code examples are provided by SAS Institute Inc. "as is" without warranty of any kind, either express or implied, including but not limited to the implied warranties of merchantability and fitness for a particular purpose. Recipients acknowledge and agree that SAS Institute shall not be liable for any damages whatsoever arising out of their use of this material. In addition, SAS Institute will provide no support for the materials contained herein.
This sample uses PROC GPLOT together with the Annotate facility to label data points in a two-dimensional plot.
| Type: | Sample |
| Topic: | SAS Reference ==> Procedures ==> GPLOT Query and Reporting ==> Creating Reports ==> Graphical ==> Graph Types ==> Plots ==> Area Query and Reporting ==> Creating Reports ==> Graphical ==> Graph Elements ==> Annotation |
| Date Modified: | 2005-08-31 03:03:16 |
| Date Created: | 2004-11-11 11:08:01 |
Operating System and Release Information
| Product Family | Product | Host | SAS Release | |
| Starting | Ending | |||
| SAS System | SAS/GRAPH | All | n/a | n/a |