Sample 24916: Plot horizontal axis values in data order with PROC GPLOT
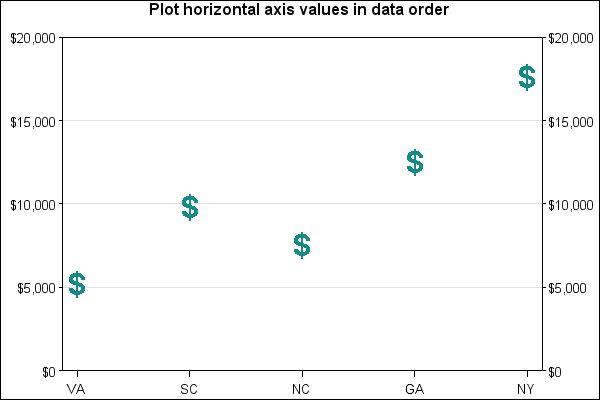
The sample code on the Full Code tab creates a new numeric horizontal axis variable that reflects the original ordering of the data. This new numeric variable is then plotted with PROC GPLOT, which automatically orders the horizontal axis in data order.
These sample files and code examples are provided by SAS Institute
Inc. "as is" without warranty of any kind, either express or implied, including
but not limited to the implied warranties of merchantability and fitness for a
particular purpose. Recipients acknowledge and agree that SAS Institute shall
not be liable for any damages whatsoever arising out of their use of this material.
In addition, SAS Institute will provide no support for the materials contained herein.
This sample creates a new numeric horizontal axis variable that reflects the original ordering of the data. This new numeric variable is then plotted with PROC GPLOT, which automatically orders the horizontal axis in data order.
After adding a new numeric ordering variable to the data set, a new data set is created for use with the CNTLIN option on PROC FORMAT. This is used to create a format to eventually format the new numeric ordering variable back to its original character values during the PROC GPLOT step.
The graphics output in the Results tab was produced using SAS® 9.2. Submitting
the sample code with releases of SAS prior to SAS 9.2 might produce different results.
 /* Set the graphics environment */
goptions reset=all cback=white border htitle=12pt htext=10pt;

 /* Create the input data set ONE */
data one;
   input State $2. Sales;
   datalines;
VA  5200
SC  9800
NC  7500
GA  12500
NY  17600
;
run;

 /* Create a new variable STATEORD that contains the     */
 /* numerical ordering of observations from the original */
 /* data set ONE.                                        */
data addn;
   set one;
   stateord=_n_;
run;

 /* Create the control data set STNAME using the ADDN    */
 /* data set. The control data set contains the 	     */
 /* following required variables:	                     */
 /* START contains the unformatted values                */
 /* LABEL contains the formatted values (state names)    */
 /* FMTNAME= contains the name of the format (DATAORD)   */
 /* TYPE= contains the type of the format, N for numeric */
 /* or C for character variables.   			         */
data stname;
   set addn(rename=(stateord=start state=label));
   fmtname='dataord';
   type='N';
   keep fmtname label start type;
run;

 /* The format DATAORD is created using the input */
 /* control data set STNAME.                      */
proc format cntlin=stname;
run;

 /* Define TITLE and SYMBOL statements */
title1 'Plot horizontal axis values in data order';
symbol1 i=none f=swissb v='$' h=3 c=vibg;
symbol2 i=none v=none;

 /* Create axis definitions */
axis1 order=(0 to 20000 by 5000) offset=(0,0)
      label=none minor=none;
axis2 minor=none offset=(3,3)
      label=none;

 /* Create the graph, making sure to format */
 /* the state order values back to their    */
 /* original character values.              */
proc gplot data=addn;
   plot sales*stateord / vaxis=axis1 autovref haxis=axis2;
   plot2 sales*stateord / vaxis=axis1;
   format sales dollar8. stateord dataord.;
run;
quit;
These sample files and code examples are provided by SAS Institute
Inc. "as is" without warranty of any kind, either express or implied, including
but not limited to the implied warranties of merchantability and fitness for a
particular purpose. Recipients acknowledge and agree that SAS Institute shall
not be liable for any damages whatsoever arising out of their use of this material.
In addition, SAS Institute will provide no support for the materials contained herein.
This sample creates a new numeric horizontal axis variable that reflects the original ordering of the data. This new numeric variable is then plotted with PROC GPLOT, which automatically orders the horizontal axis in data order.
| Type: | Sample |
| Topic: | SAS Reference ==> Procedures ==> GPLOT
|
| Date Modified: | 2005-08-31 03:03:14 |
| Date Created: | 2004-11-11 11:08:00 |
Operating System and Release Information
| SAS System | SAS/GRAPH | All | n/a | n/a |


